


There's nothing like a steep increase in fuel costs to encourage people to start paying attention to how much power they're using in their everyday lives.
Tips on how to save energy are everywhere, but the ideal way to cut back on your power consumption is to isolate the devices using the most energy and either reduce their usage or replace them with more efficient green-rated appliances.
There are guides out there to give you average consumption figures for your electrical goods, but wouldn't it be nicer if you could see exactly how much electricity is being used as you're using it?
If this idea sounds attractive, you'll be pleased to hear that gadgets that monitor electricity usage in real-time are already on the market. We're going to be looking at one such monitor: the Current Cost meter.
This is a portable device that receives a wireless signal from a sensor on your electricity meter, allowing you to monitor your power usage wherever you are in the home. More excitingly, the unit will also allow you to download the data onto your computer thanks to the serial port at its base.
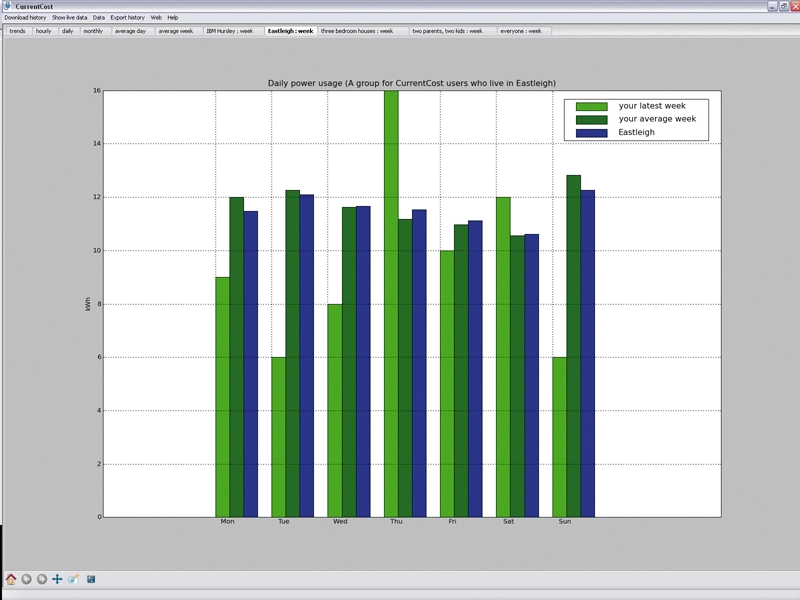
Once downloaded, it's easy to analyse your data and even share it with others using interfaces developed by the community of Current Cost users. This means you can compare – and even compete to lower – your electricity usage with that of other similar households.
We're getting a bit ahead of ourselves here. First we need to buy and set up the Current Cost meter. The unit costs £45. This may seem expensive, but if it encourages you to cut back on your electricity usage, it could pay for itself in a very short time. Some electricity companies are giving them away, so make sure that you check this out before stumping up the cash.
There are currently two versions of the meter, and this tutorial is concerned with the newer CC128 version. However, if you already have the older CC02 model, it's still possible to read its data using these methods and a little care.
Fitting the meter
The meter comes in two parts: the sensor, which fits around the mains cable leading to your home's electricity meter, and the wireless LCD display. Anyone can fit the Current Cost sensor: you just put the sensor jaws loosely around the thick round electrical wire that leads to your house from your meter (typically this is a grey wire).
If you see any burn marks or bare wires around your home meter, call in a professional electrician to check it out before installing the Current Cost device.
The sensor jaws work by using electromagnetic induction to measure the flow of electricity going through the wire. This doesn't provide an exact reading, as there are many variables to consider – the insulation on the wires, how close the clamp is to the wire and so on – but it does provide a way to monitor changes in demand, and as these are all relative, they provide a useful indication of your electricity use.
The sensor runs on batteries and sends the collected data wirelessly to the LCD display unit. On this you can see your usage measured in watts, the calculated cost per month and simple charts showing the previous day's usage, the total kWh used in the past day and month, and the temperature and time. If you tell the meter the cost of your electricity, it will also show how much you're spending.
From meter to PC
To get this data out of the display unit and onto your PC, you need a specialised USB lead. These are available from the Current Cost Ebay page (see the Resources box for the URL).
Although the port on the base of the Current Cost meter looks like a typical Ethernet socket, it won't connect to another Ethernet port. This is because it's treated as a serial connection. The Current Cost USB lead available from the Ebay store allows the connection to be seen as a virtual COM port on your computer.
The Prolific PL-2303 drivers provided support Windows 2000 and XP, Mac OS X and Linux (although some kernels include support without extra drivers).
The data is sent out in XML format every six seconds, so in principle it's easy to monitor everything in real-time. As the meter only stores a limited amount of historical data, it's much better to dump the data onto your computer instead.
To see what's in the feed, use something like HyperTerminal on Windows XP (if you're using Vista, try Putty). It will look something like this:
CC128-v0.11
00131
11:06:33
18.9
1
01234
1
00318
00000
00000
Each reading is sent out as a single line of XML. XML uses a similar tagging method to HTML, but where HTML tags specify how to display the data in a browser, XML defines the content.
Let's break down the Current Cost feed into its components by describing what the tags mean:
• – Start of message.
• – The source and software version.
• – This means 'days since birth', as in how long the meter has been installed.
• – The time that the reading was taken in hours, minutes and seconds.
• – Current temperature.
• – Appliance number.
• – The communication channel for the device.
• – Which sensor it's receiving data from ('1' means electricity). The unit accepts up to three sensors.
• – The value given by the first channel clamp.
• – How much electricity is being used, measured as you would expect in watts.
At a longer interval (one minute past every odd hour), the unit also provides historical data measured in kWh in periods of two hours ( is the data from two hours ago), days ( is the data from one day ago) and months ( is the data from one month ago).
If you're interested in delving deeper, there's a much fuller explanation of the tags at CurrentCost.com.