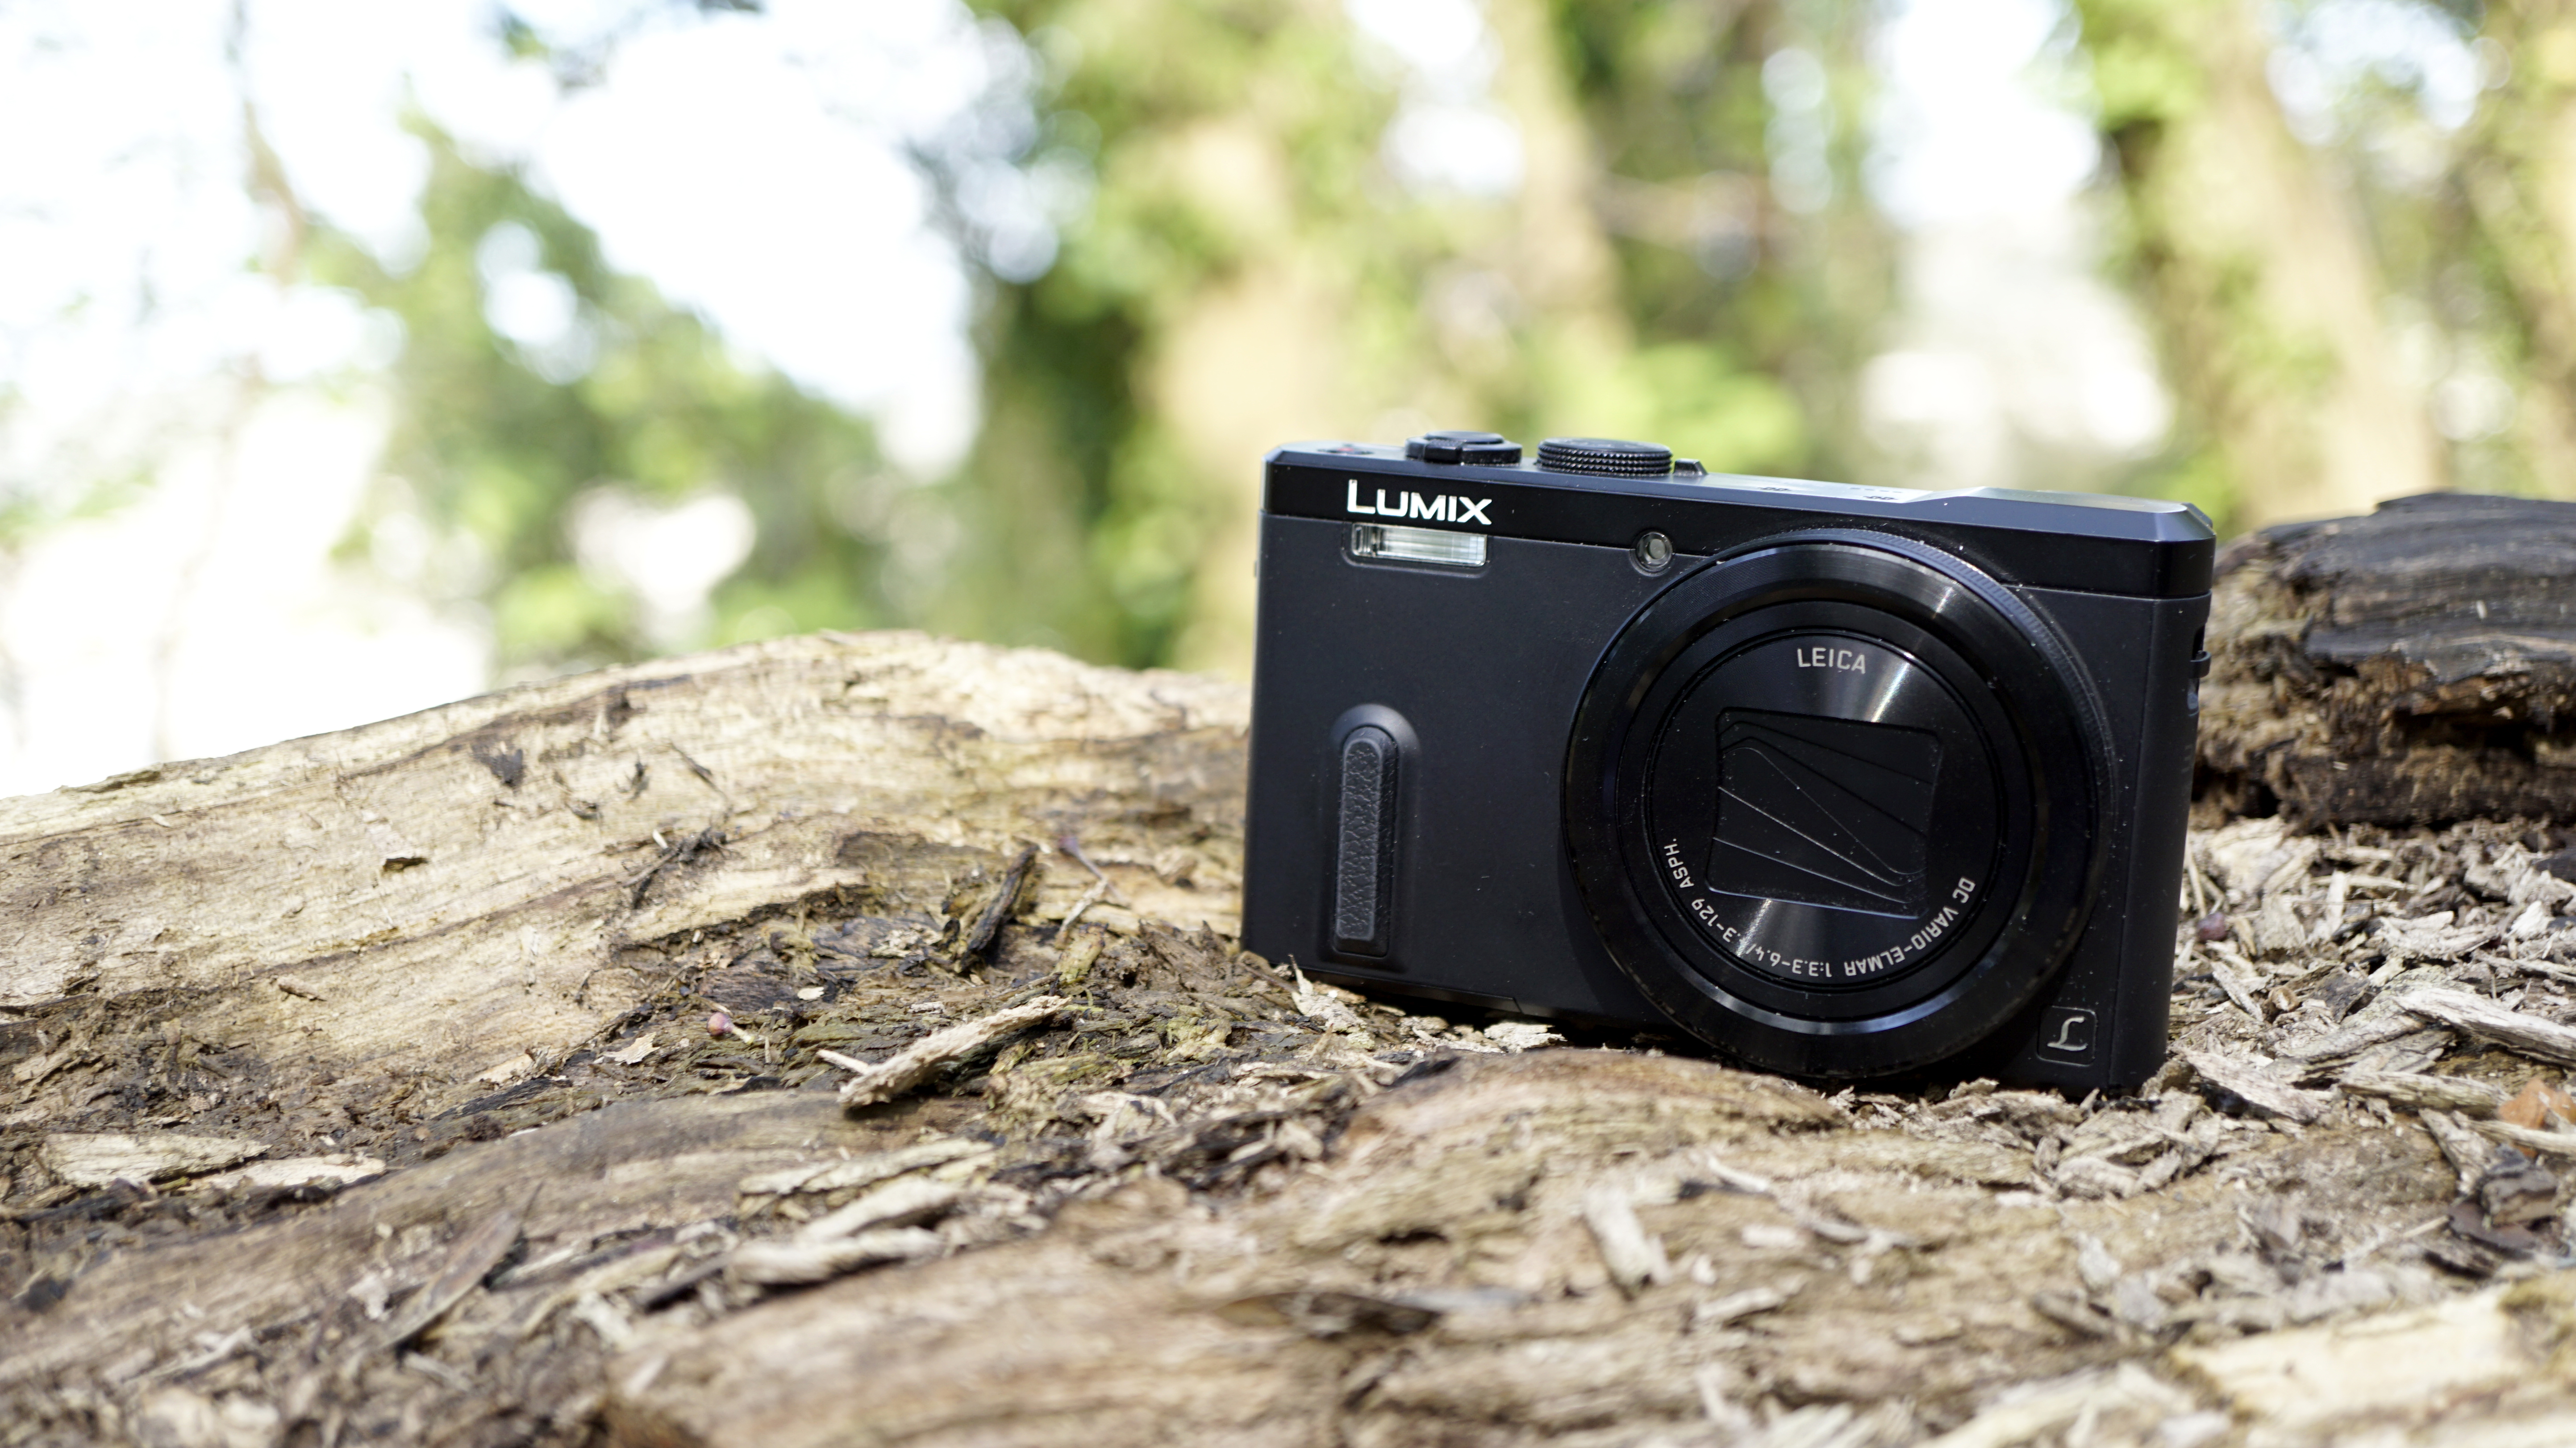
Why you can trust TechRadar
As part of our image quality testing for the TZ60, we've shot our resolution chart.
For a full explanation of what our resolution charts mean, and how to read them, check out our full explanation of our camera testing resolution charts.
Examining images of the chart taken at each sensitivity setting reveals the following resolution scores in line widths per picture height x100:
JPEG
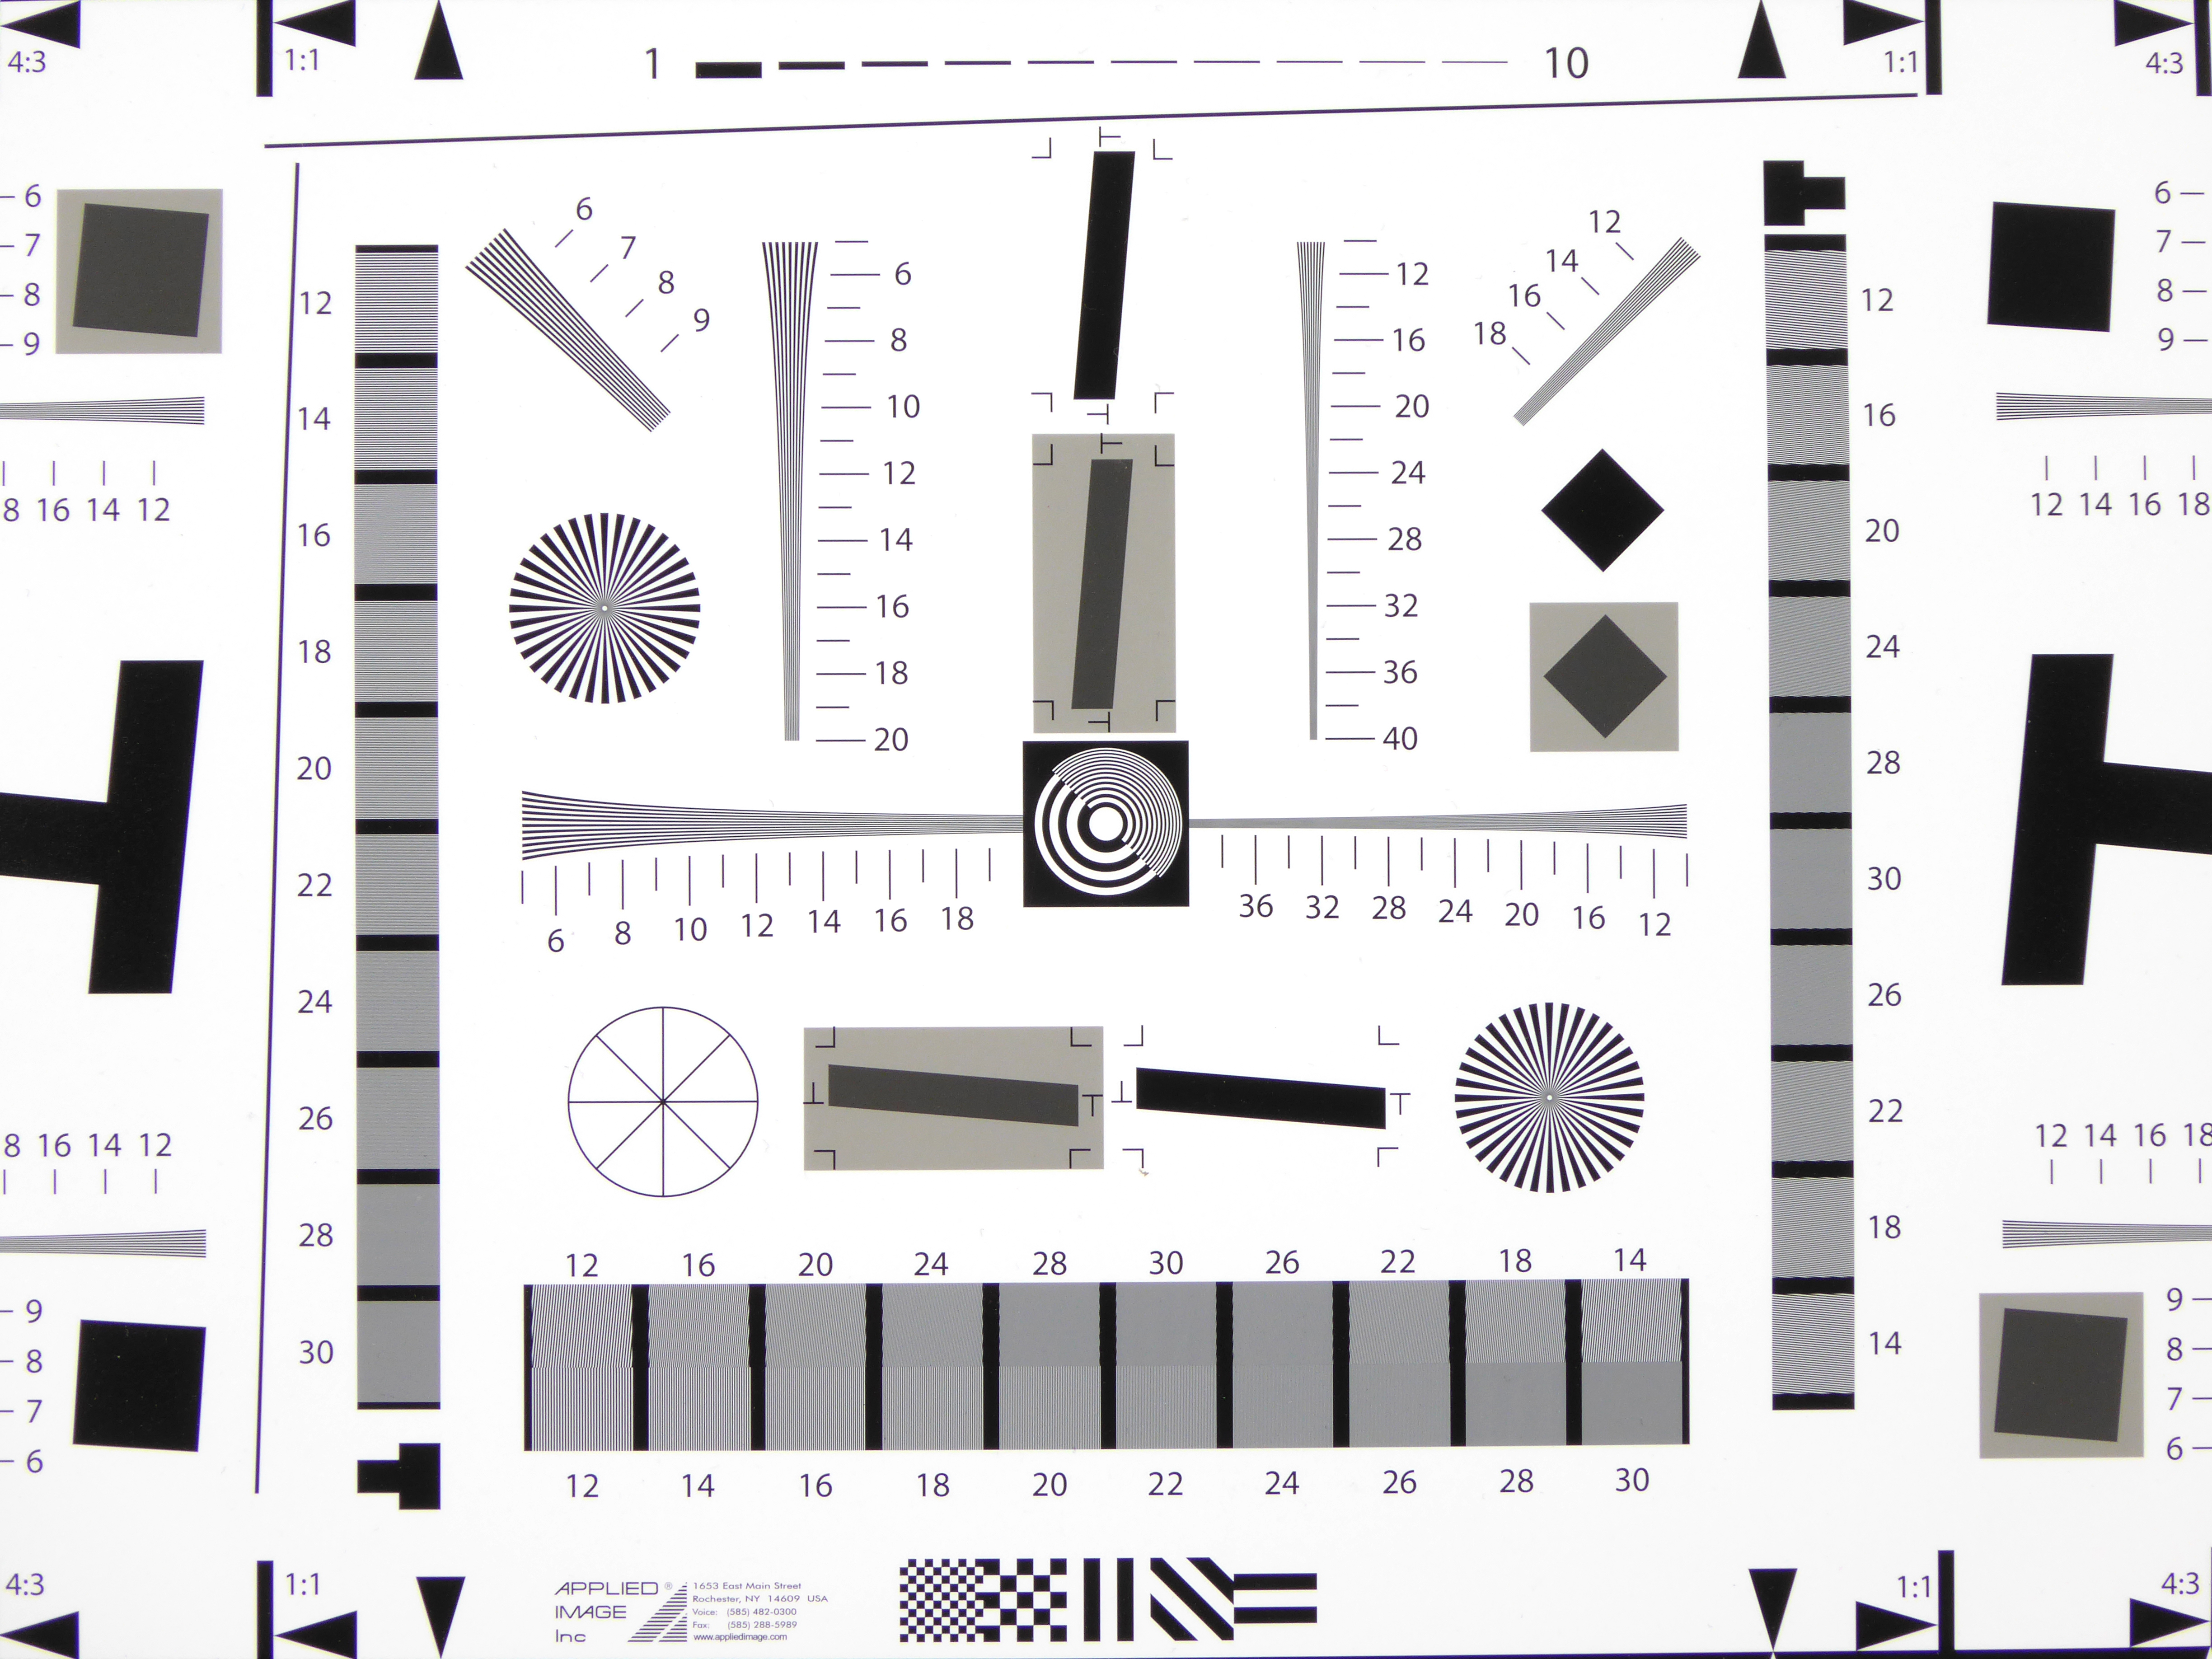
The full ISO 100 resolution chart image.
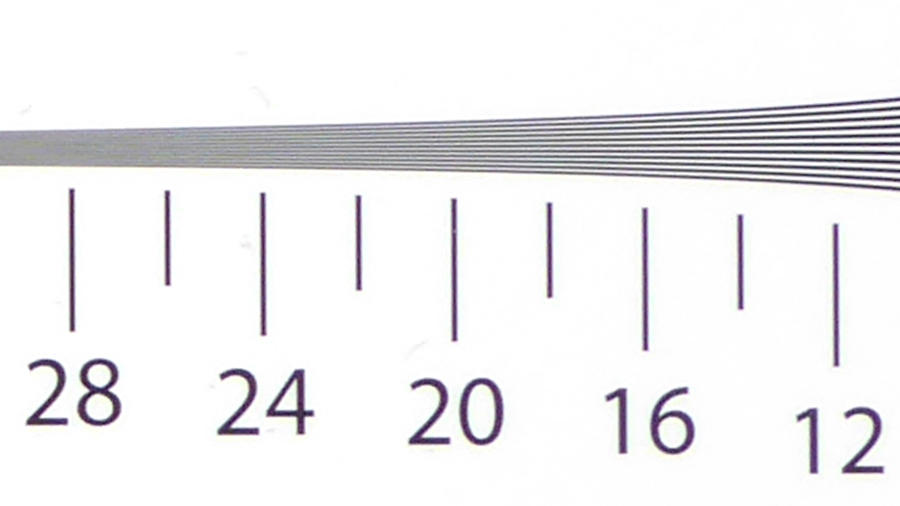
ISO 100, Score: 24. Click here to view the full resolution image.
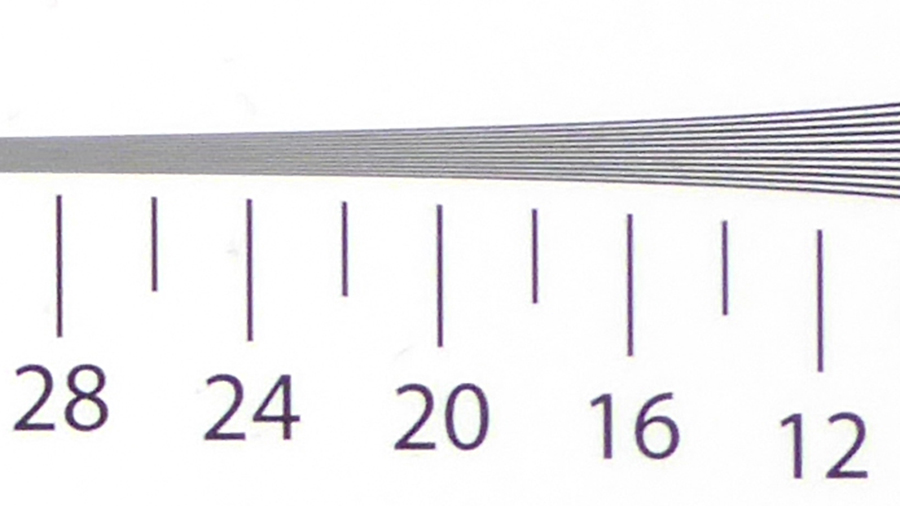
ISO 200, Score: 22. Click here to view the full resolution image.
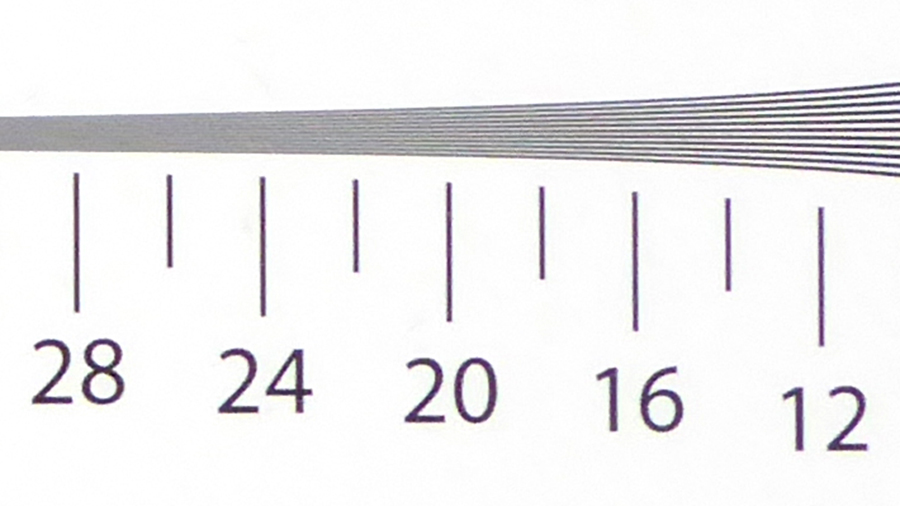
ISO 400, Score: 20. Click here to view the full resolution image.
Sign up for breaking news, reviews, opinion, top tech deals, and more.
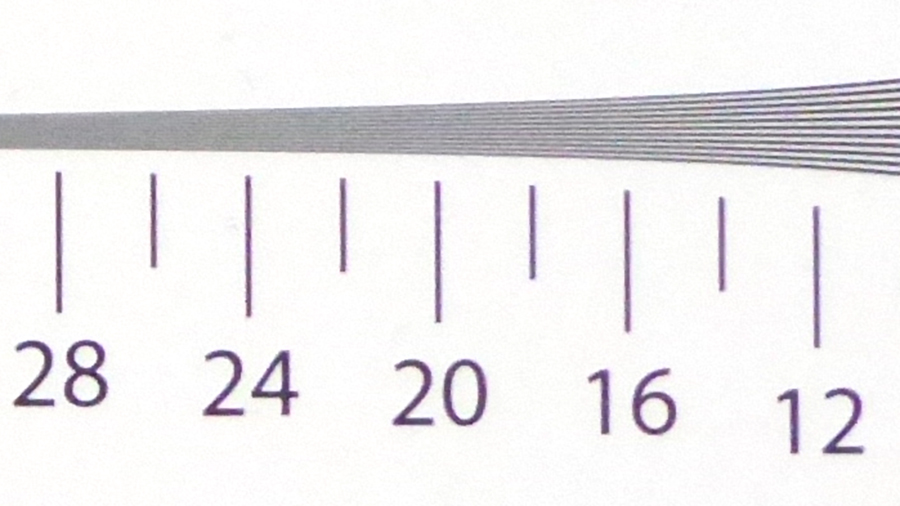
ISO 800, Score: 18. Click here to view the full resolution image.
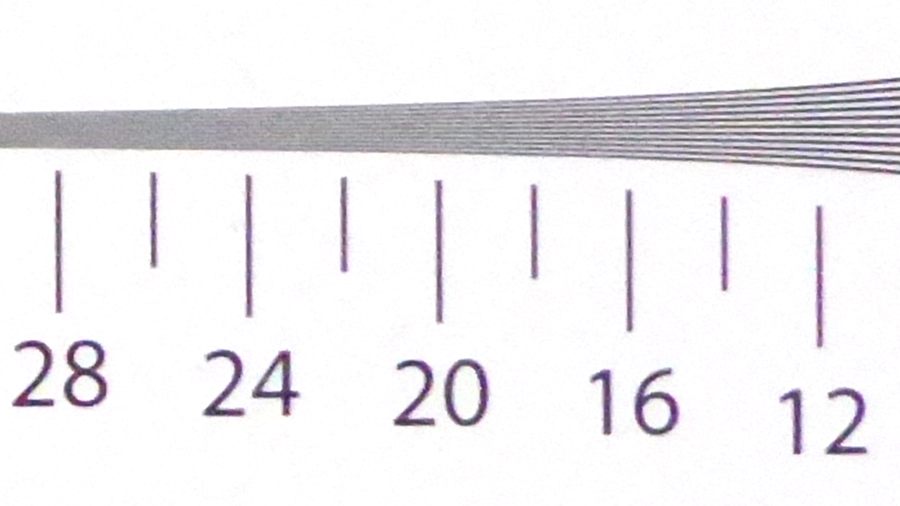
ISO 1600, Score: 18. Click here to view the full resolution image.
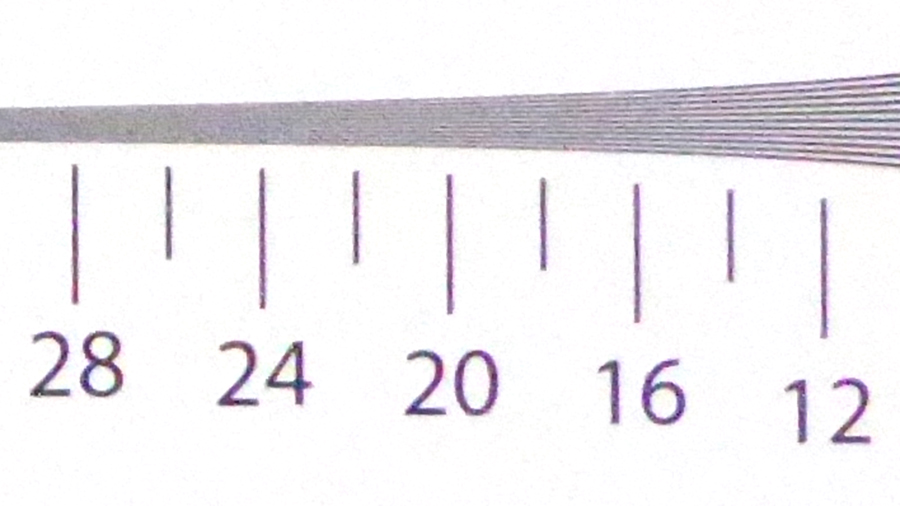
ISO 3200, Score: 16. Click here to view the full resolution image.
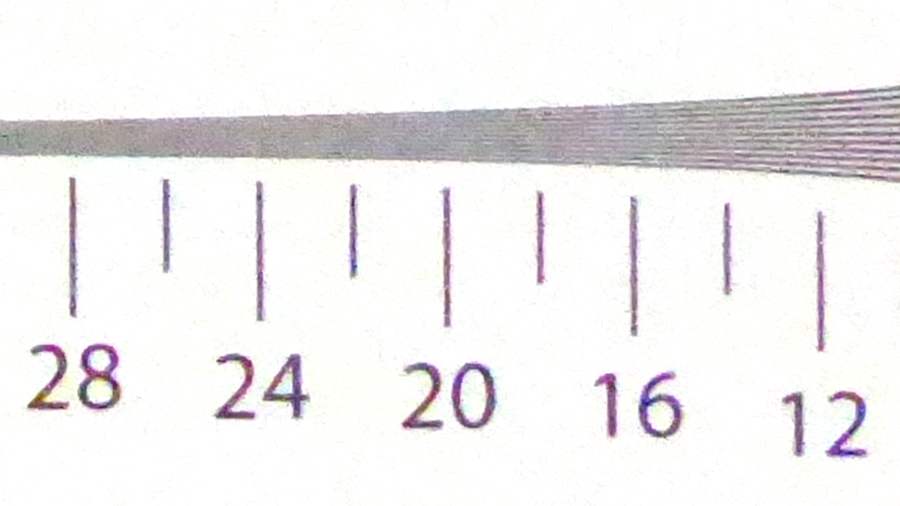
ISO 6400, Score: 12. Click here to view full resolution image.
Raw
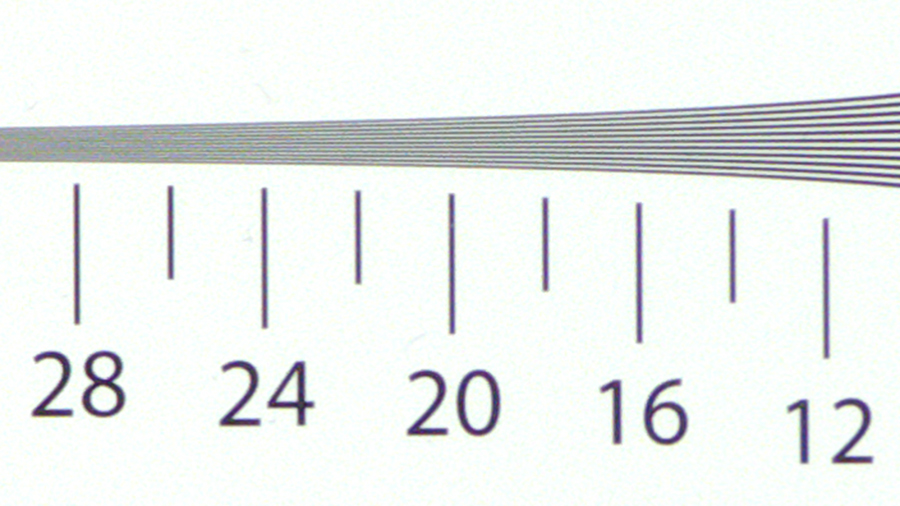
ISO 100, Score: 24. Click here to view the full resolution image.
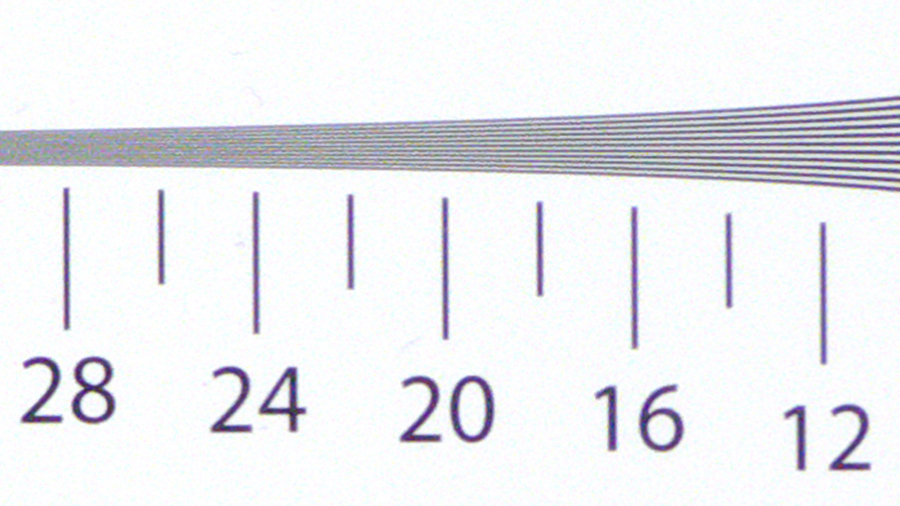
ISO 200, Score: 24. Click here to view the full resolution image.
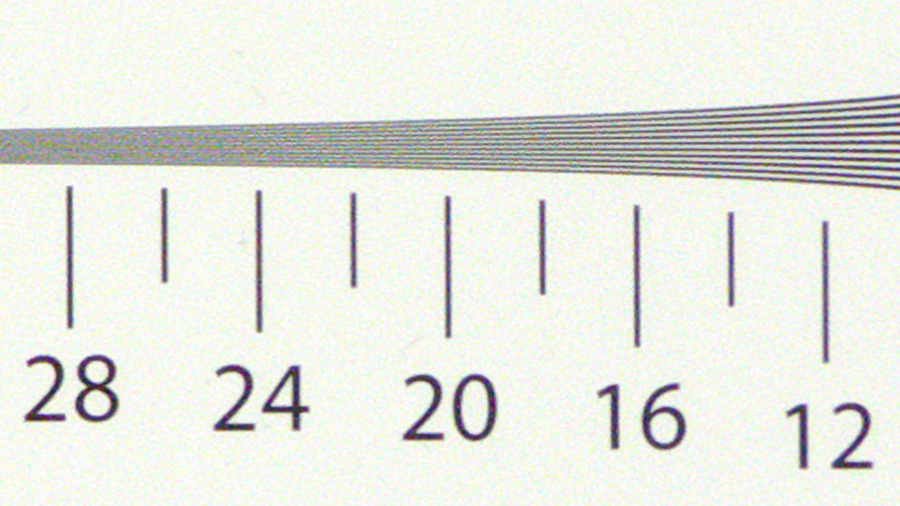
ISO 400, Score: 22. Click here to view the full resolution image.
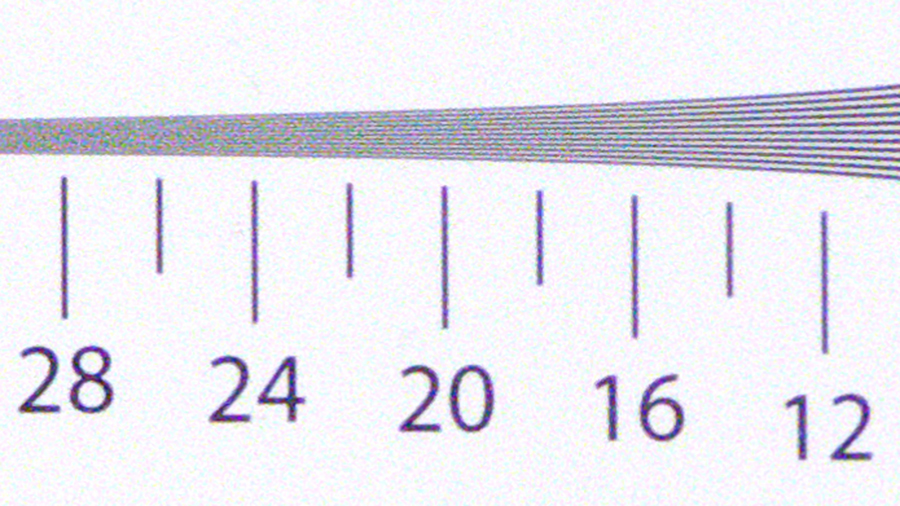
ISO 800, Score: 20. Click here to view the full resolution image.
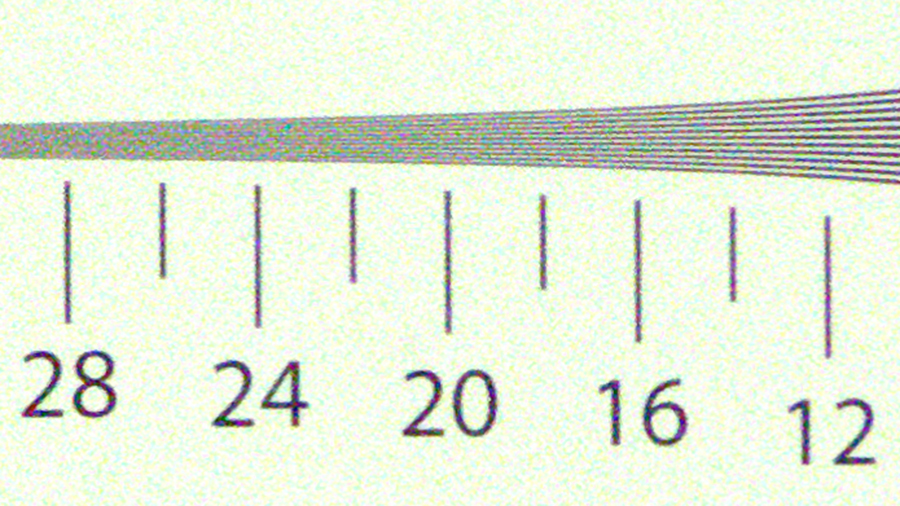
ISO 1600, Score: 18. Click here to view the full resolution image.
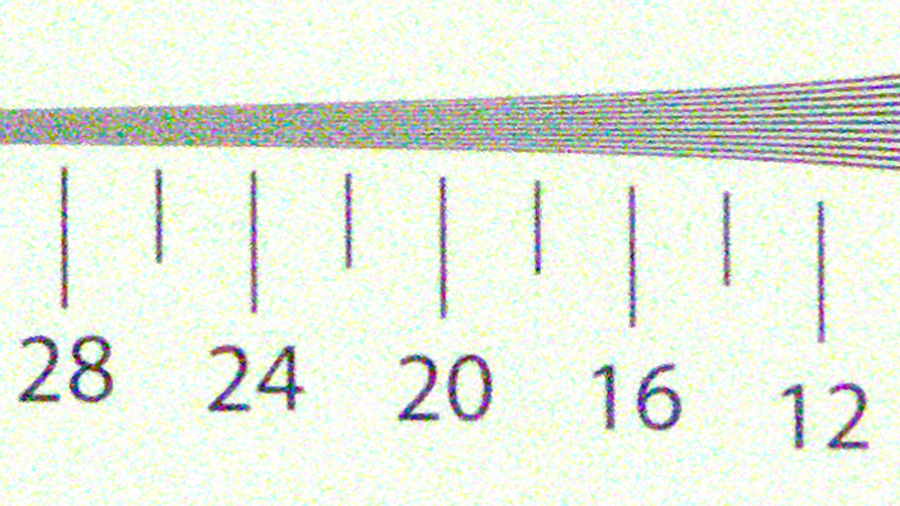
ISO 3200, Score: 16. Click here to view the full resolution image.
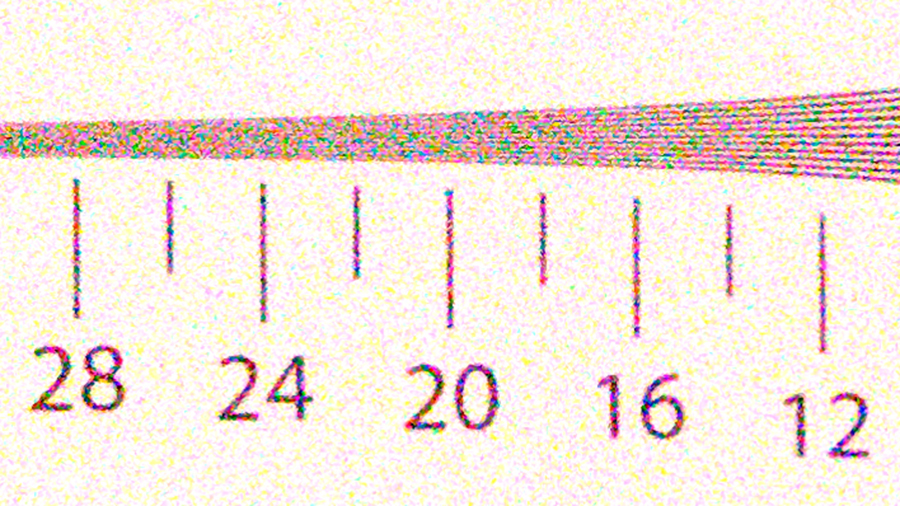
ISO 6400, Score: 14. Click here to view the full resolution image.
Ali Jennings is the imaging lab manager for Future Publishing's Photography portfolio. Using Imatest Master and DxO Analyser he produces the image quality tests for all new cameras and lenses review in TechRadar's cameras channel. Ali has been shooting digital since the early nineties and joined Future's Photography portfolio back in 2003.
