Samsung PL170 review: TechRadar labs data
Resolution charts, noise and dynamic range graphs
Sign up for breaking news, reviews, opinion, top tech deals, and more.
You are now subscribed
Your newsletter sign-up was successful
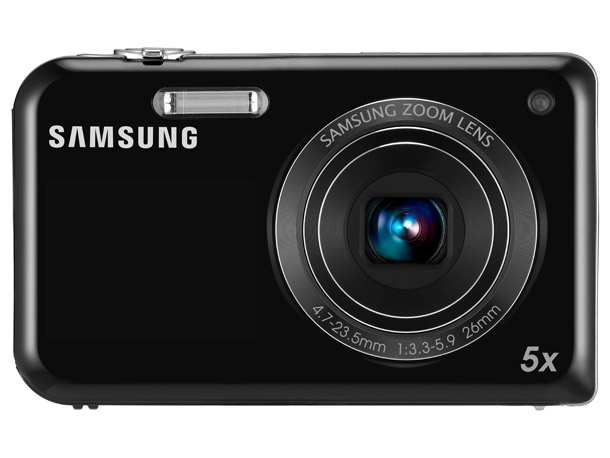
Our test of the Samsung PL170 is on the way, but in the mean time we would like to share the resolution chart images and the noise and dynamic range results.
As part of our image quality testing for the Samsung PL170, we've shot our resolution chart.
If you view our crops of the resolution chart's central section at 100% (or Actual Pixels) you will see that, for example, at ISO 100 the Samsung PL170 is capable of resolving up to around 20 (line widths per picture height x100) in its highest quality JPEG files.

Examining images of the chart taken at each sensitivity setting reveals the following resolution scores in line widths per picture height x100:
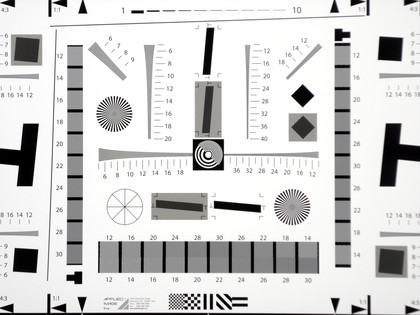
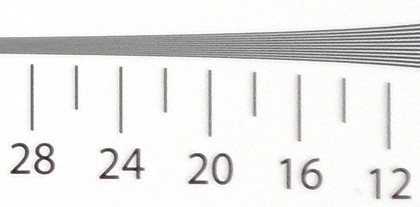
ISO 80, score: 20 (see full image)
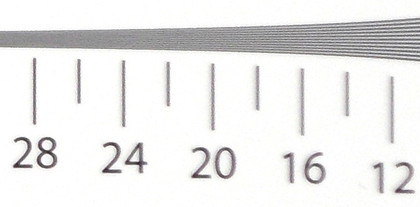
ISO 100, score: 20 (see full image)
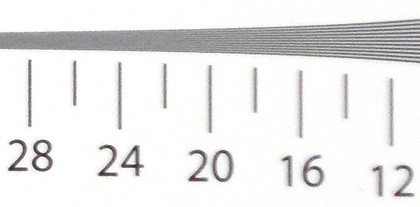
ISO 200, score: 18 (see full image)
Sign up for breaking news, reviews, opinion, top tech deals, and more.
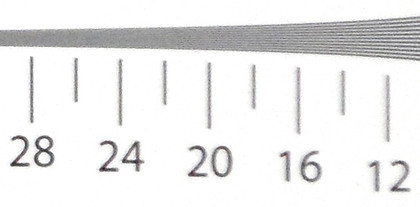
ISO 400, score: 16 (see full image)
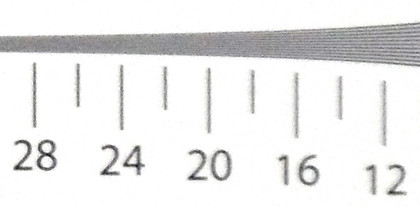
ISO 800, score: 12 (see full image)
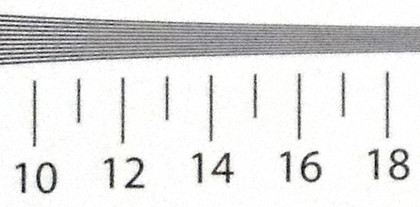
ISO 1600, score: 13 (see full image)
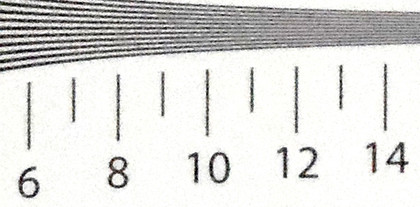
ISO 3200, score: 10 (see full image)
Noise and dynamic range
These graphs were produced using data generated by DXO Analyzer.
We shoot a specially designed chart in carefully controlled conditions and the resulting images are analysed using the DXO software.
Signal to noise ratio
A high signal to noise ratio (SNR) indicates a cleaner and better quality image.
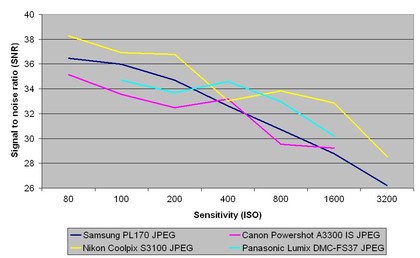
JPEG images from the Samsung PL170 show a good Signal to Noise ratio up to a sensitivity of ISO 200, from ISO 400 the chart shows a steady decline, and at ISO 3200 noise is a real issue.
Dynamic range
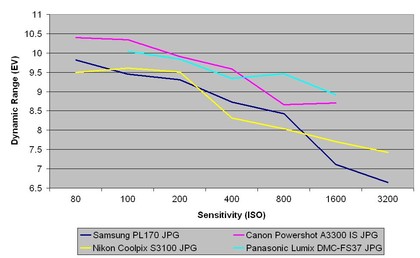
This chart indicates that the Samsung PL170's JPEGs are on par with the Nikon Coolpix S3100, but are on average 1EV lower than the Canon Powershot A3300 IS and Panasonic Lumix DMC-FS37.
Ali Jennings is the imaging lab manager for Future Publishing's Photography portfolio. Using Imatest Master and DxO Analyser he produces the image quality tests for all new cameras and lenses review in TechRadar's cameras channel. Ali has been shooting digital since the early nineties and joined Future's Photography portfolio back in 2003.