
 Become a TechRadar Insider


Noise and dynamic range
As part of our camera testing process we shoot a chart that enables us to measure a camera's dynamic range and the amount of noise that it produces.
A camera's dynamic range is a measure of its ability to record different brightness levels within the same image. A camera with a high dynamic range (DR) for example, can record bright details such as clouds as well the grass in a landscape. The clouds will be burned out to a uniform white by a camera with a low dynamic range.
Noise is the coloured speckling (chroma noise) and light and dark mottling (luminance noise) that can be seen in some images. Noise becomes more visible when high sensitivity (ISO) settings are used or the images are blown up to make large prints.

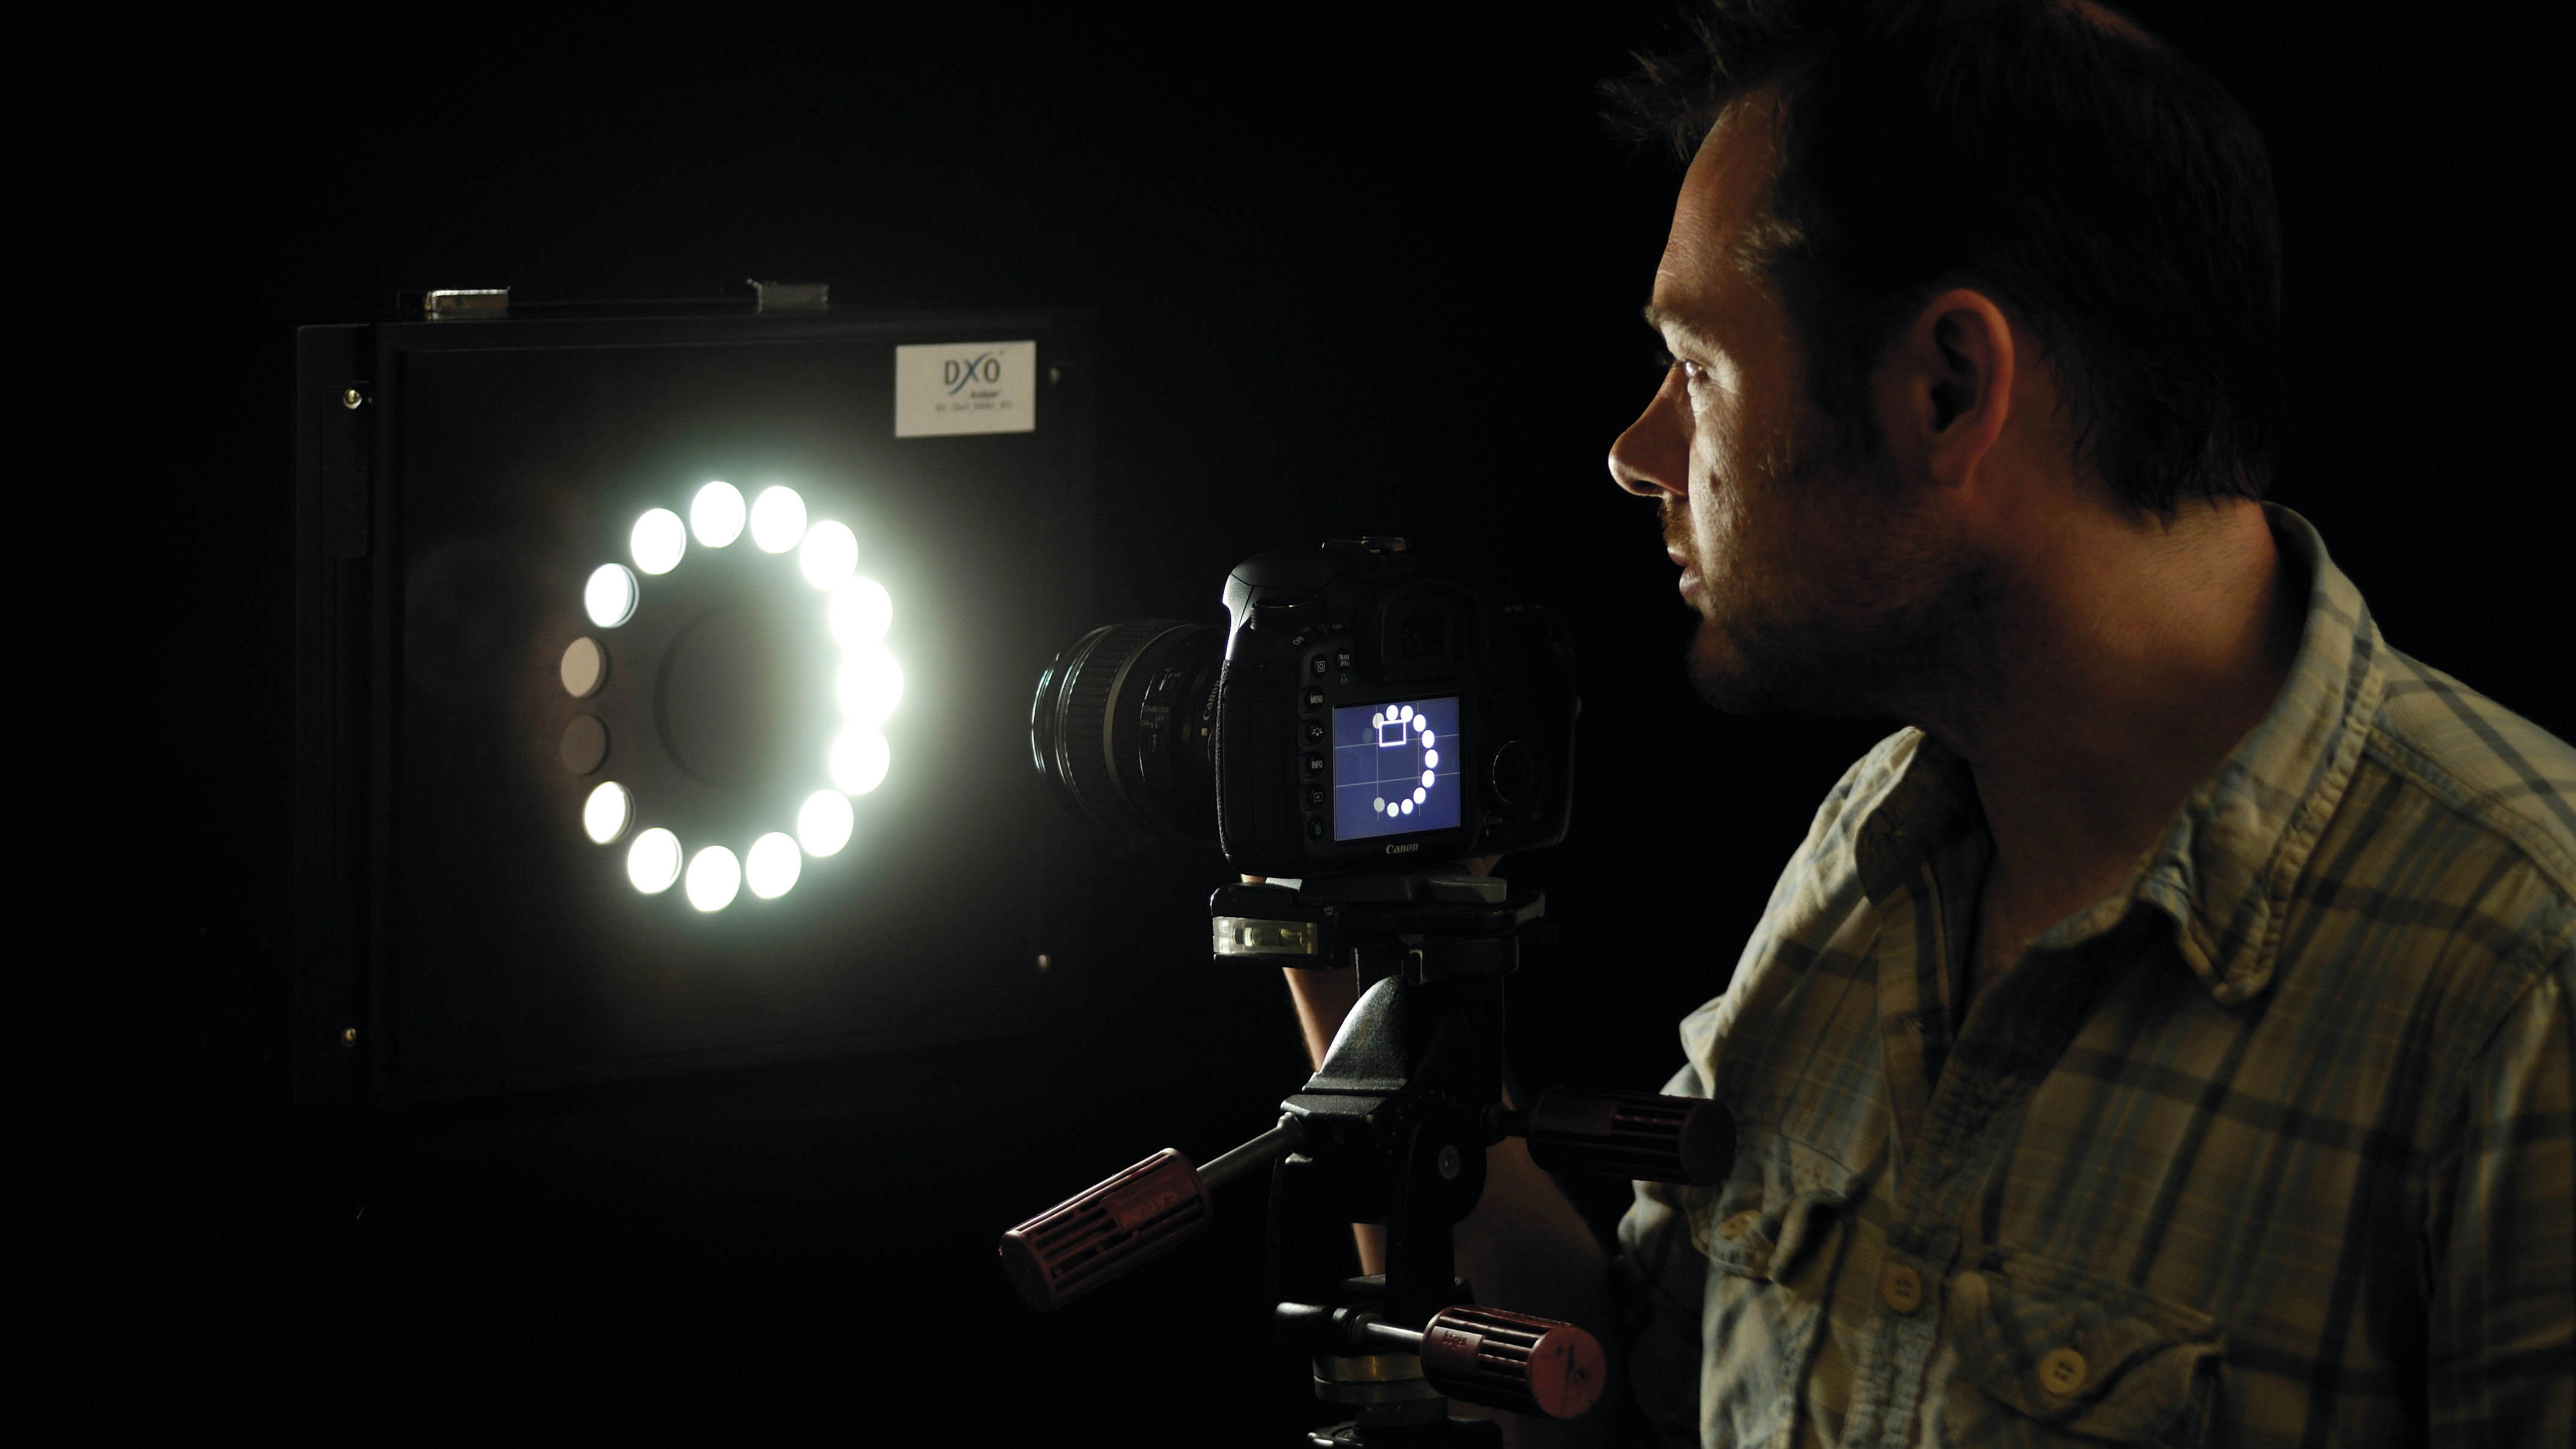
The chart
We shoot our noise and dynamic range chart at every available sensitivity (ISO) setting and analyse the images using DxO Analyzser software. The software measures the signal and the noise that makes up the image and gives a Signal to Noise Ratio (SNR) value. The higher the SNR reading, the cleaner the image signal and the lower the noise value.
A high SNR is generally better than a low SNR. However, a high SNR at high sensitivities can sometime be attributed to in-camera noise reduction and image smoothing, which can destroy detail.
Our noise and dynamic range chart, is supplied by DXO and it's made up of a series of pure optical glass filters with a range of neutral densities mounted in a thick plastic plate. The chart is held on a purpose-made light box that produces diffuse, uniform illumination.
Using a glass target avoids the lighting problems and inconsistencies that are often associated with printed charts for assessing dynamic range. The glass also removes the issue of media texture that can create issues for accurate noise measurement with printed targets.
Our test laboratory is set up following DxO guidelines and images of the chart are assessed using the DxO Analyzer software to generate signal to noise ratio (SNR) and dynamic range values across a camera's full sensitivity range - for both raw and JPEG images. If the software is not compatible with a camera's raw files we convert them to TIFF format and analyse these images. We only compare files of the same format, JPEGs with JPEGs, raw with raw and TIFF with TIFF.
Follow the links for more information about DxO Analyzser