How to build a Raspberry Pi home heating monitor
Visualise your central heating

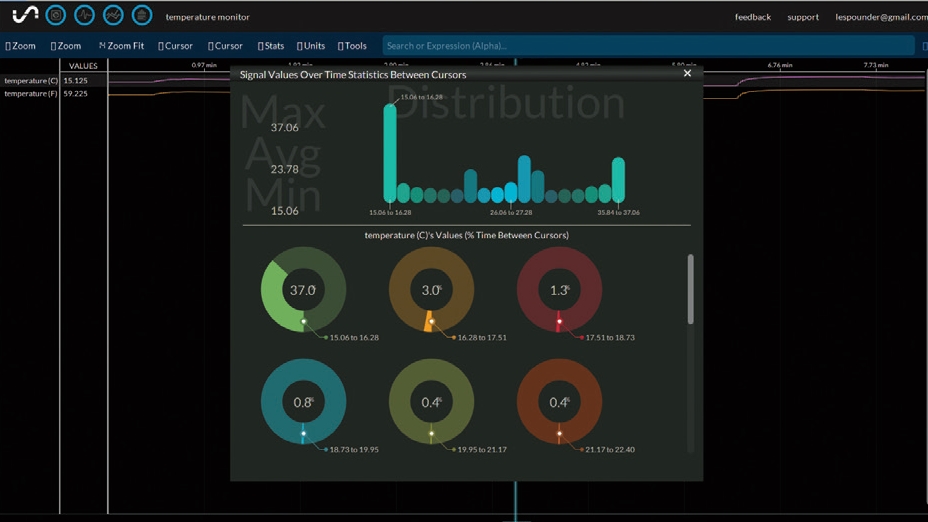
For this Raspberry Pi project, we'll dunk our heads into the Internet of Things (IoT). We'll determine the temperature of our home using a cost-effective sensor and push that data to the cloud and use it to populate a graph.
The sensor we're using is a Dallas DS18B20. These can be picked up relatively cheaply, but an easy solution is to buy the CamJam EduKit 2 as it includes a waterproof Dallas DS18B20.
What you will need
- Any Raspberry Pi A+ B+ or Pi 2
- The latest Raspbian OS
- A DS18B20 sensor (part of the Cam Jam EduKit 2)
- Breadboard
- Male to Female jumper cables
- 4.7kOhm resistor
- WI-FI dongle
- An www.initialstate.com account
- Download the code
Building the project
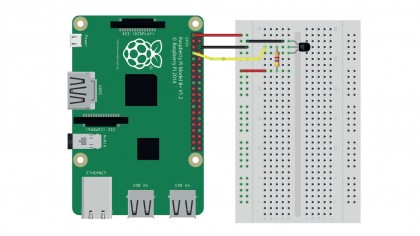
Assemble the hardware and attach to your Pi as per the diagram (see below).

Next, we set up the sensor and there's a handy Cam Jam worksheet for this. To proceed you'll need an Initial State account and your API key, which you'll find in your account settings.
To install the Initial State streamer type:
\curl -sSL https://get.initialstate.com/python -o - | sudo bash
We start our code by importing libraries to work with the OS, time and to stream our data to the cloud:
Sign up for breaking news, reviews, opinion, top tech deals, and more.
import os, glob, time
from ISStreamer.Streamer import Streamer
Next, we load the kernel modules for the sensor using modprobe , we wrap the Bash commands in an os.system() function for Python and tell our code where to find the file for storing the temperature data:
os.system('modprobe w1-gpio')
os.system('modprobe w1-therm')
base_dir = '/sys/bus/w1/devices/'
device_folder = glob.glob(base_dir + '28*')[0]
device_file = device_folder + '/w1_slave'
Next, we create a function to handle reading the contents of the file which stores the raw temperature data and stores the data as a variable.

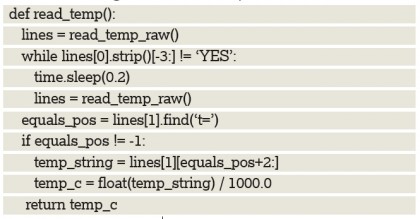
Now we read the data and process it into something more usable. We keep the information and strip the rest of the data before converting the data to a temperature.

Our last section is a loop that constantly checks the temperature, performs conversions and streams the data to Initial State every minute.

Save the code and click on Run > Run Module to start.
Initial state
In this project we sent temperature data to the cloud using a service called Initial State. This service enables users to graph and manipulate data from multiple sources at once.
We used the free tier in this tutorial, which retains our data for 24 hours before deleting it. There are other tiers which can retain data indefinitely for an unlimited number of sensors.
For our project we used one sensor input, a DS18B20, but thanks to the Raspberry Pi and its GPIO we can use many more sensors to gather data about our home, eg in another tutorial we used a reed switch. This too can be used with Initial State so that we can show data when doors are opened.
So using this service we can interpret data about our home. Such things as reed switches on windows; temperature sensors in rooms; a clamp on our electric meter and light sensors outside can be used to provide data on how energy efficient our home is and this data can be graphed for many months to show our usage over the seasons.
This data can be used with a central heating system to control your home automatically using a humble Raspberry Pi.