Why you can trust TechRadar
We shoot a specially designed chart in carefully controlled conditions and the resulting images are analysed using DXO Analyzer software to generate the data to produce the graphs below.
A high signal to noise ratio (SNR) indicates a cleaner and better quality image.
For more more details on how to interpret our test data, check out our full explanation of our noise and dynamic range tests.
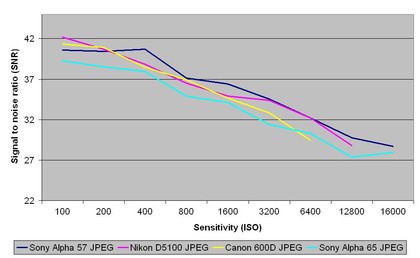
JPEG images from the Sony Alpha 57 shows good signal to noise ratio results across the sensitivity range. At all sensitivities the results between the cameras are close with the Nikon D5100 and Canon 600D just beating the a57 at ISO 100, however at all other sensitivities the a57 has the edge.
Raw images
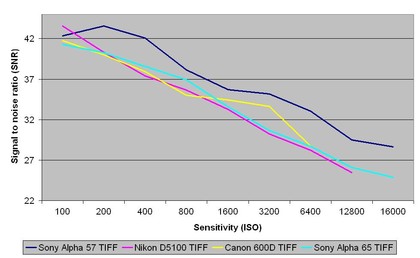
TIFF images (After conversion from raw) show that whilst the Nikon D5100 beats the at a sensitivity of ISO 100 at all other sensitivities the show better signal to noise ratio results. This chart shows that noise only becomes really apparent in images from ISO 12800.
Dynamic range
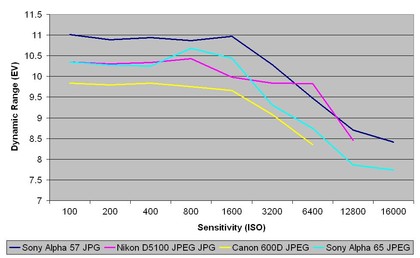
This chart shows the Alpha 57 has consistent dynamic range results between sensitivities of ISO 100-1600 beating the Canon 600D, Nikon D5100 and improving on the performance of the Alpha 65.
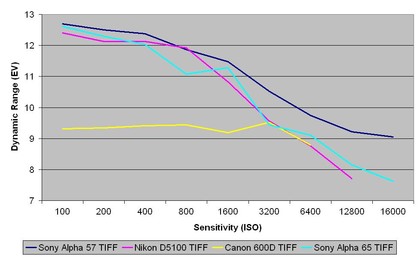
This chart shows that the Sony Alpha 57's TIFF files (After conversion from raw) have a high dynamic range between sensitivities of ISO 100 and 1600, and across the rest of the sensitivity range beat the comparison cameras. This show that at all sensitivities the a57 is able to capture a good tonal graduation in both the shadows and highlights.
Sign up for breaking news, reviews, opinion, top tech deals, and more.
Current page: Noise and dynamic range
Prev Page Image quality and resolution Next Page Sample images