Why you can trust TechRadar
We shoot a specially designed chart in carefully controlled conditions and the resulting images are analysed using DXO Analyzer software to generate the data to produce the graphs below. We tested the D-Lux against three of its main rivals, the Panasonic LX100, Sony RX100 III and Fuji X30.
A high signal to noise ratio (SNR) indicates a cleaner and better quality image.
For more more details on how to interpret our test data, check out our full explanation of our noise and dynamic range tests.
JPEG signal to noise ratio
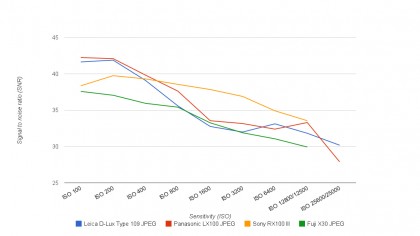
Analysis: The D-Lux mirrors the characteristics of the Panasonic LX100 so closely that they can be considered the same. This is no surprise, given that they are essentially the same camera, though Leica versions of Panasonic cameras do sometimes show different processing styles. Both dip unexpectedly below the performance of the Sony RX100 III at medium ISO settings.
Raw (converted to TIFF) signal to noise ratio
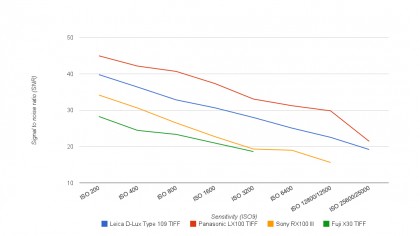
Analysis: Interestingly, the D-Lux raw files show a slightly poorer signal to noise ratio than the Panasonic's – though both are comfortably better than the Sony RX100 III and Fuji X30.
JPEG dynamic range
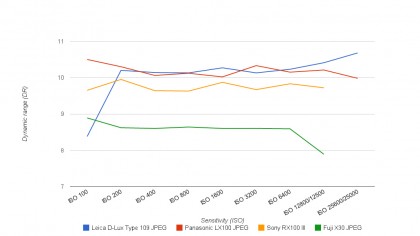
Analysis: For some reason, the dynamic range of the D-Lux takes a bit of a dip at its lowest sensitivity setting of ISO 100, but from then on it's a close match for the near-identical Panasonic LX100. Both are visibly better than the Sony RX100 III and well clear of the Fuji X30, suggesting that the size of the sensor (and hence its photosites) has a direct bearing on dynamic range in this case.
Raw (converted to TIFF) dynamic range
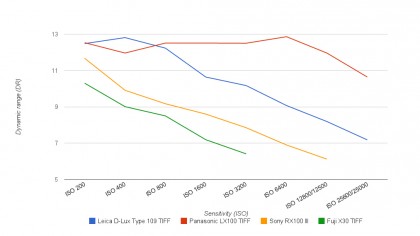
Analysis: Again, the Panasonic's raw files show better performance than the D-Lux's Both are some way clear of the Sony RX100 III and Fuji X30.
Sign up for breaking news, reviews, opinion, top tech deals, and more.
Current page: Noise and dynamic range
Prev Page Image quality and resolution Next Page Sensitivity and noise images