Why you can trust TechRadar
This is a test of the camera's noise levels. The higher the signal to noise ratio, the greater the difference in strength between the real image data and random background noise, so the 'cleaner' the image will look. The higher the signal to noise ratio, the better.
Sony RX10 II signal to noise ratio charts
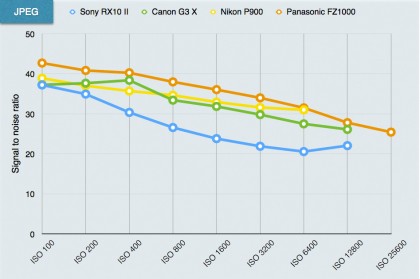
JPEG signal to noise ratio analysis: Again, the RX10 II puts in a slightly disappointing result, some way below the signal to noise ratio of the Canon, Panasonic and even the Nikon. All this means in practice, though, is that Sony may have decided to reduce the level of noise reduction in its JPEG files for more natural, if noisier, detail rendition.
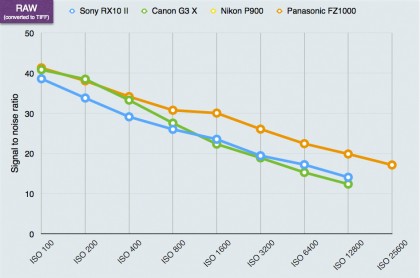
Raw (converted to TIFF) signal to noise ratio analysis: In fact the signal to noise ratio of the RX10 II's raw files is much closer to the rest, though it still lags noticeably behind its big rival, the Panasonic FZ1000, right across the ISO range.
Sample Sony RX10 II ISO test results
The signal to noise ratio charts use laboratory test equipment, but we also shoot a real-world scene to get a visual indication of the camera's noise levels across the ISO range. The right side of the scene is darkened deliberately because this makes noise more obvious.

ISO 200: Click here for a full-size version.

ISO 6400: Click here for a full-size version.
Sign up for breaking news, reviews, opinion, top tech deals, and more.

Amy has been writing about cameras, photography and associated tech since 2009. Amy was once part of the photography testing team for Future Publishing working across TechRadar, Digital Camera, PhotoPlus, N Photo and Photography Week. For her photography, she has won awards and has been exhibited. She often partakes in unusual projects - including one intense year where she used a different camera every single day. Amy is currently the Features Editor at Amateur Photographer magazine, and in her increasingly little spare time works across a number of high-profile publications including Wired, Stuff, Digital Camera World, Expert Reviews, and just a little off-tangent, PetsRadar.
