Why you can trust TechRadar
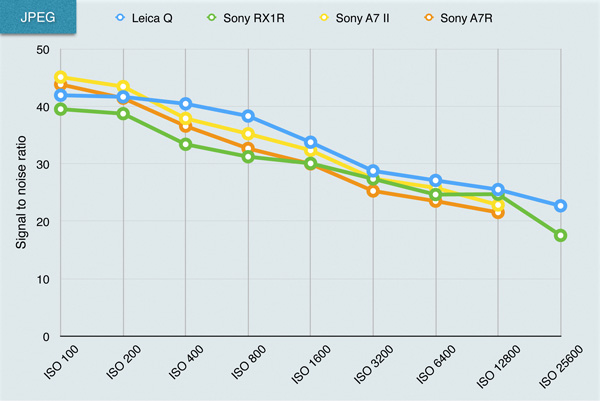
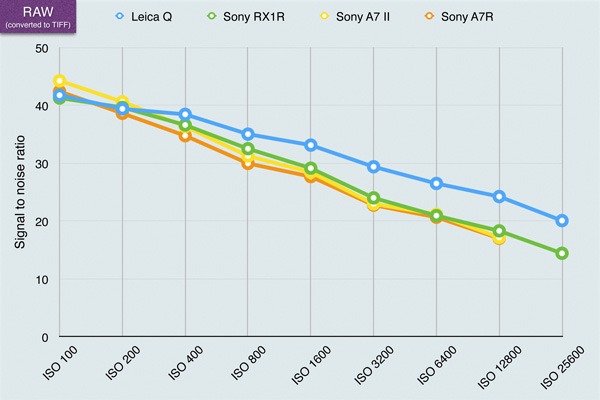
This is a test of the camera's noise levels. The higher the signal to noise ratio, the greater the difference in strength between the real image data and random background noise, so the 'cleaner' the image will look. The higher the signal to noise ratio, the better.
Leica Q signal to noise ratio charts

JPEG signal to noise ratio analysis: All of the cameras score well for signal to noise ratio, showing the benefit of a large sensor and a sensible pixel count. The Q particularly impresses at high sensitivity values indicating that it controls noise a bit better than the other cameras.

Raw (converted to TIFF) signal to noise ratio analysis: The Q performs very well, beating all the competing cameras for much of the sensitivity range, indicating that it produces relatively little noise. This is especially impressive given the high resolution scores.
Sample Leica Q ISO test results
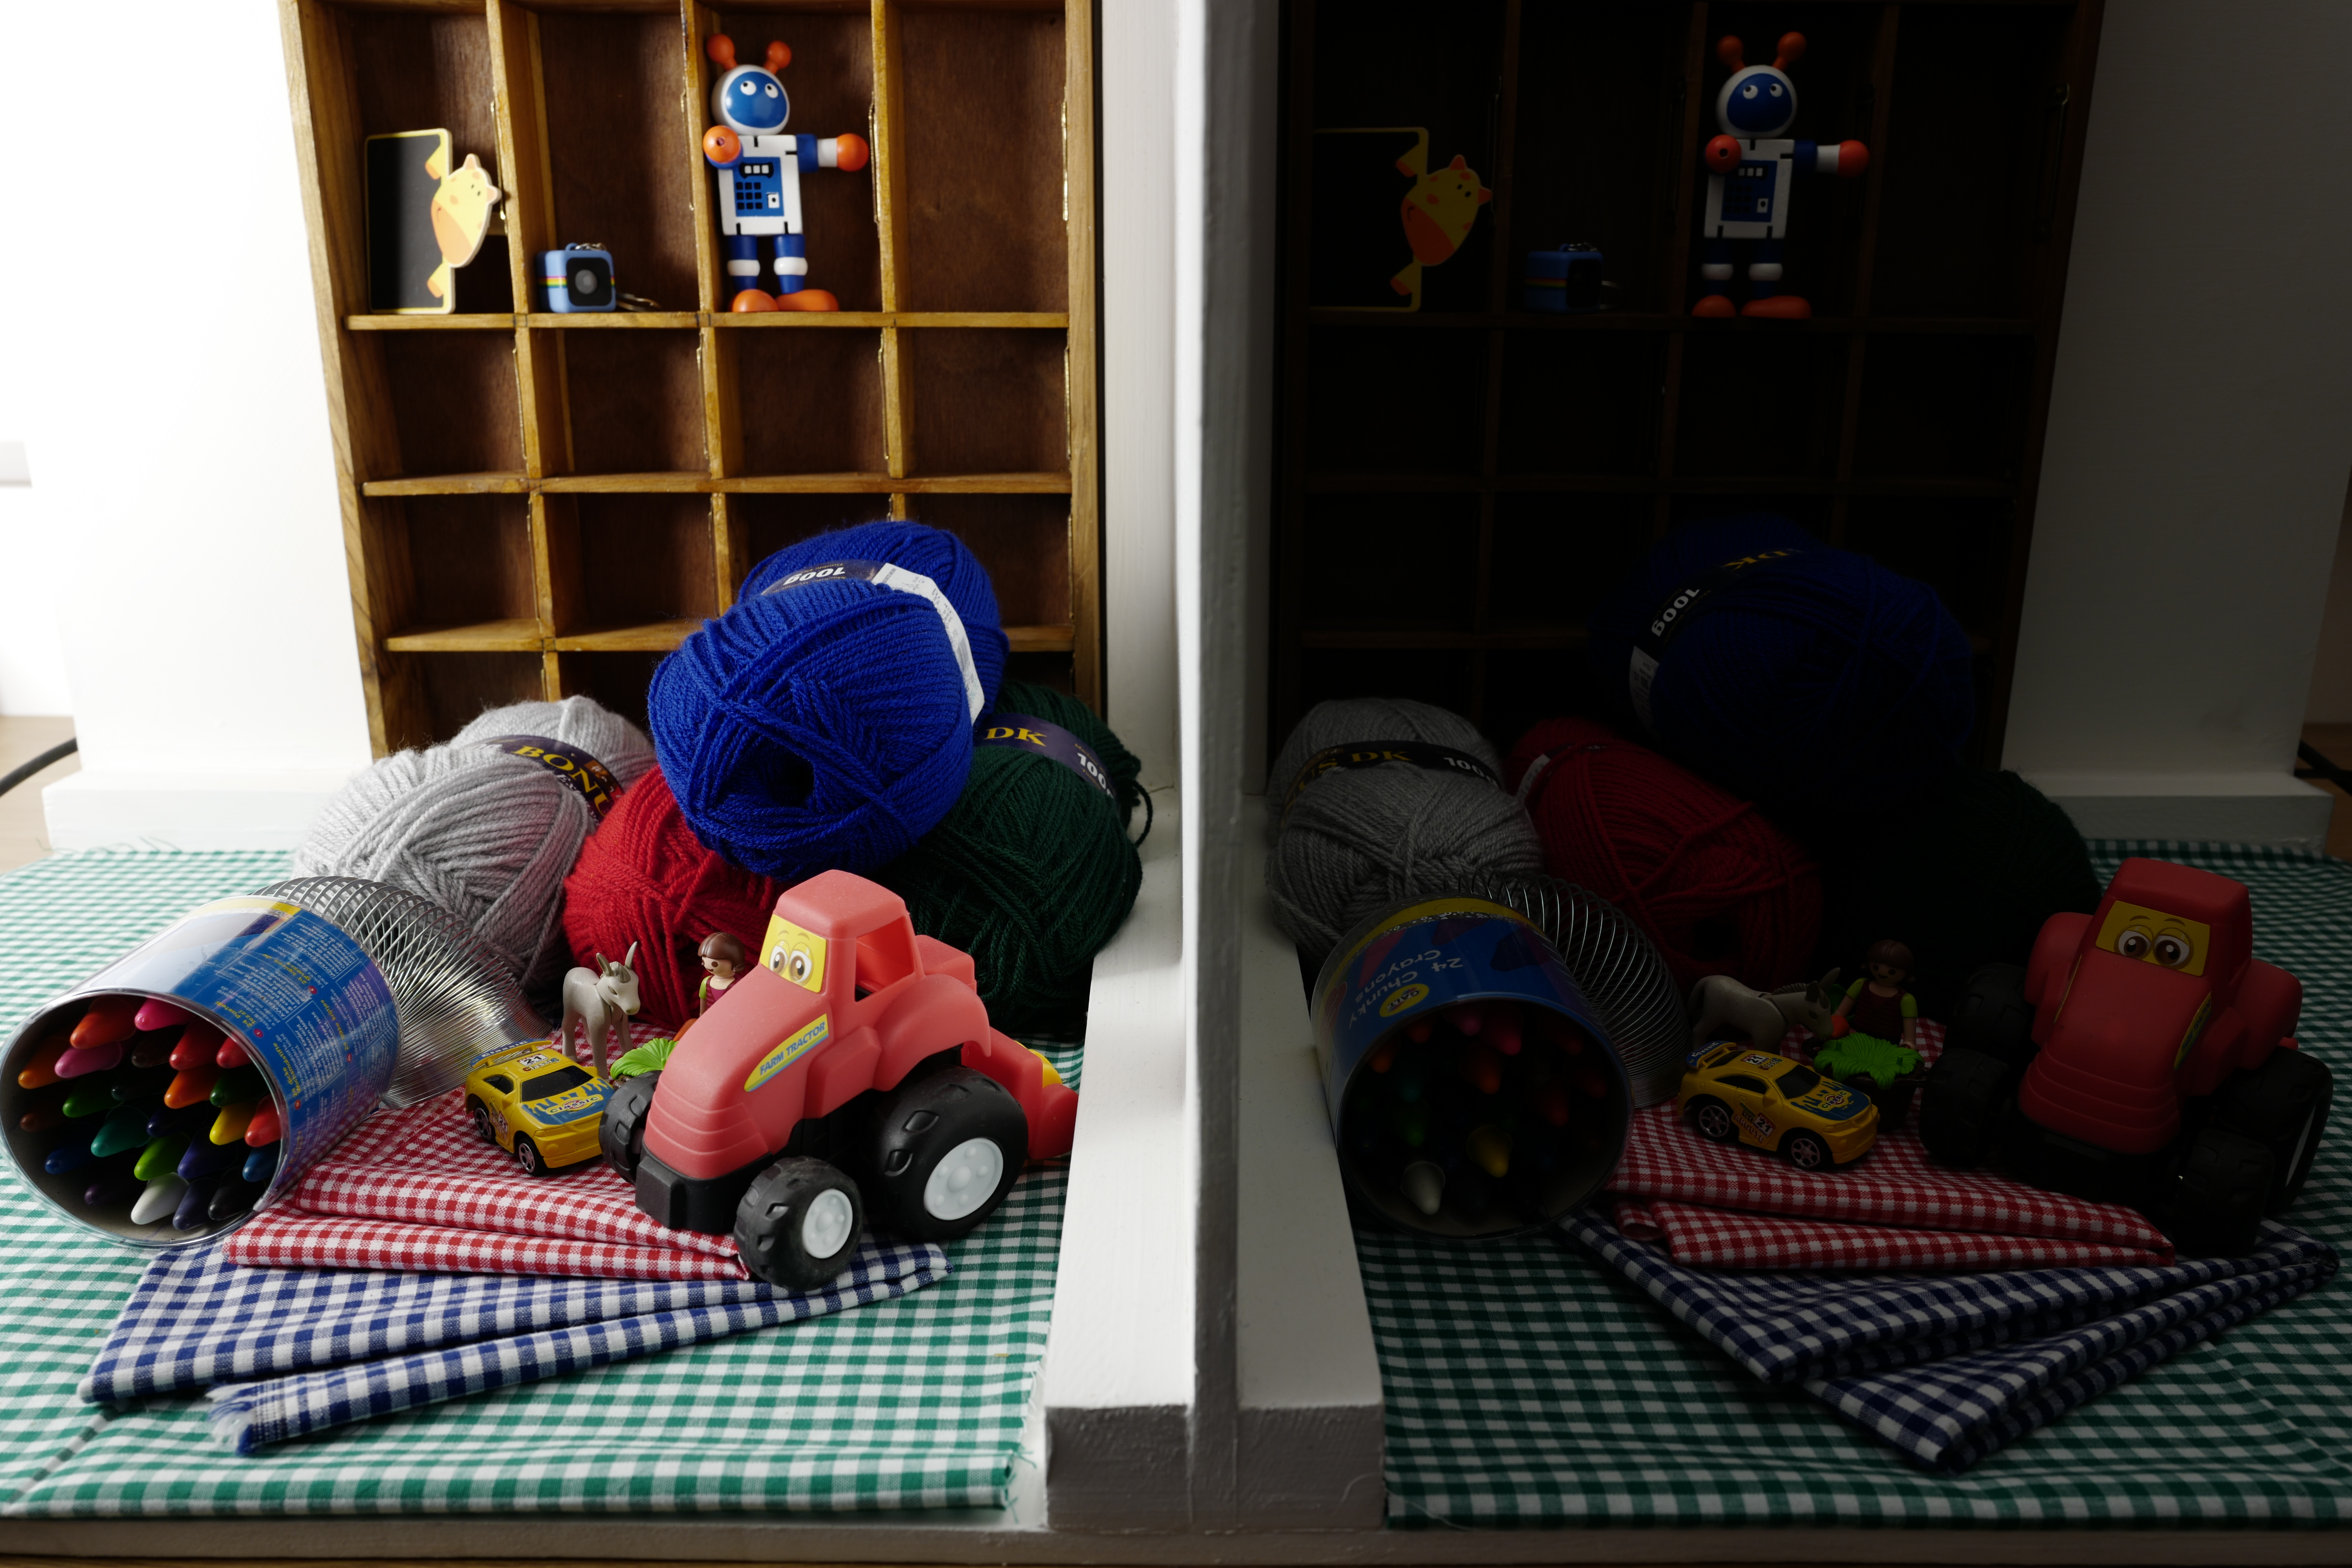
The signal to noise ratio charts use laboratory test equipment, but we also shoot a real-world scene to get a visual indication of the camera's noise levels across the ISO range. The right side of the scene is darkened deliberately because this makes noise more obvious.

ISO 100: Click here for a full size version.

ISO 6400: Click here for a full size version.
Sign up for breaking news, reviews, opinion, top tech deals, and more.
