How to read a histogram: what you can learn from your camera's exposure graph
Histogram lesson

Most photographers know that you can check the exposure of the shots you've taken simply by reviewing them on your camera's LCD screen. But looking at the picture alone can be misleading. Knowing how to read your camera's histogram is the most important thing you can do to ensure a good exposure.
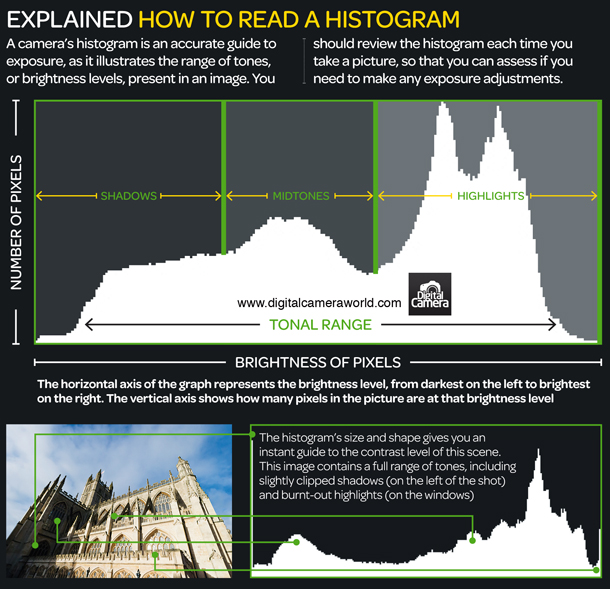
Your camera gives you the option to show the range of brightness in your image as a graph, which plots the light levels from jet black, on the left, to pure white, on the right.
A 'perfect' histogram rises gently from the left, rises in the middle and drops on the right, indicating a full range of tones but no loss of detail in shadows or highlights.
If shots are too bright, the graph will look bunched up at the right, suggesting burnt-out highlights. However, if the shot is underexposed, the graph will look stacked to the left. In both cases, such patterns suggest exposure compensation might be necessary.
In the first of our cheat sheets below, we've illustrated three typical histograms you might encounter... and what they mean.
Simply click on the infographic to see the larger version, or drag and drop it to your desktop to download.

Our second photography cheat sheet takes one subject and explains how this exposure chart represents the range of tones withing this scene. Simply drag and drop this chart on to your desktop and keep it for a handy reference the next time you find yourself confused as to how to read a histogram.
Sign up for breaking news, reviews, opinion, top tech deals, and more.

But it's not always that simple to read a histogram.
Not all scenarios give a histogram that fits perfectly along the width of the graph. With low-contrast scenes, the histogram won't reach both extremes of the graph.
With high-contrast scenes, the graph will look squashed towards both sides. In these cases, expose so that the right-hand side of the histogram is placed as far right as it can go without being 'clipped' - you'll retain detail in the brightest highlights.
It doesn't matter if low-contrast shots look too light or high-contrast shots look too dark - the brightness can be adjusted on your computer later.
What is clipping?
Finally, 'clipping' is a slang term used by photographers to describe loss of detail in highlights or shadow areas of an image due to over- or underexposure.