Google's Street View cars are now tracking air pollution
Block by block

Sign up for breaking news, reviews, opinion, top tech deals, and more.
You are now subscribed
Your newsletter sign-up was successful
What's the leading cause of deaths in the world today? I'll give you a hint. It's not obesity or malnutrition. It's not HIV, malaria, bird flu or any other infectious disease. It's not war, and it's definitely not terrorism.
It's air pollution - responsible for 5.5 million deaths in 2015. Toxins and particles suspended in the air contribute to an enormous range of conditions and diseases, from heart attacks, to stroke, to mental illness, to neurological and respiratory disorders. Almost half of the world's population, rising to 80 percent of people living in cities, breathe air that is unsafe for humans.
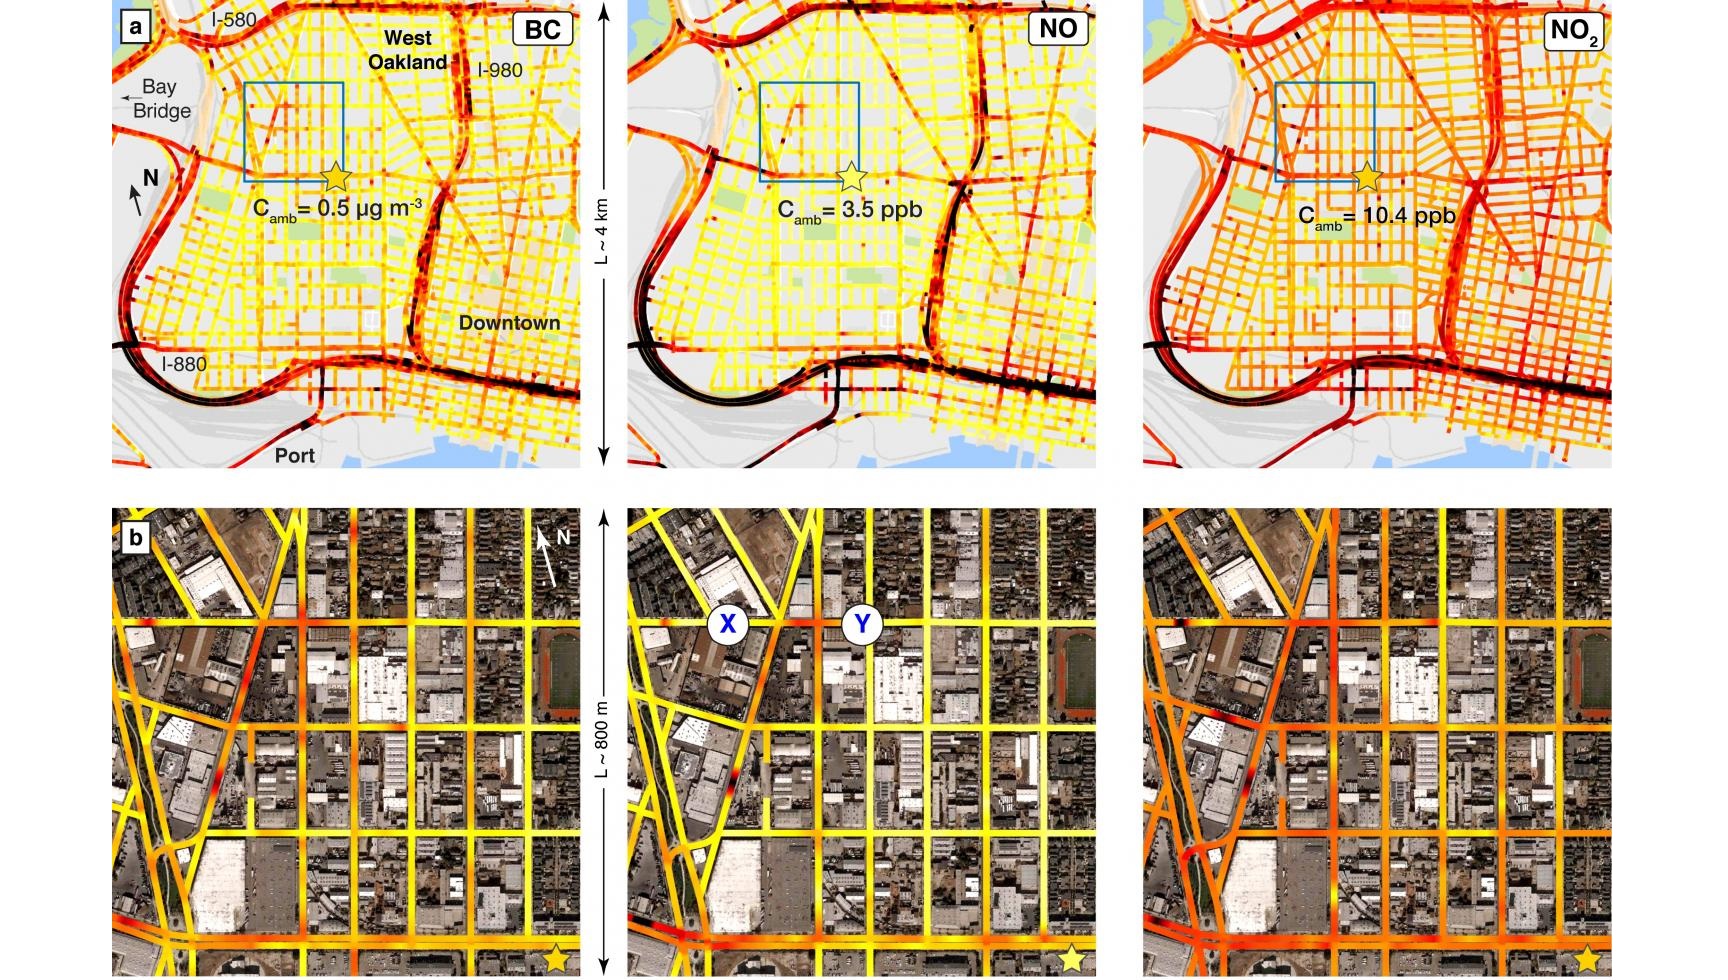
But it's hard to tell, if you live in a city, where the most dangerous areas are. That's why, for the last year, Google has been driving its Street View cars around Oakland, California, with air pollution sensors on the roofs. And now the company has released its first map of the results.
In partnership with the University of Texas, the search company mapped 78 square miles of Oakland over an entire year, collecting readings every 30 metres or so. That's an extremely high level of detail - substantially greater than is possible with traditional static air quality monitors. Most large urban areas have one air quality monitor for every 100-200 square miles.
Incredible detail
"Air pollution varies very finely in space, and we can't capture that variation with other existing measurement techniques," said Joshua Apte, an assistant professor at the Cockrell School of Engineering and lead author of a paper describing the results that was published in the journal Environmental Science and Technology.
"Using our approach and analysis techniques, we can now visualize air pollution with incredible detail. This kind of information could transform our understanding of the sources and impacts of air pollution."
What surprised the researchers in the data is that there are locations that can be six times more polluted on one end of a city block than on the other. Hotspots included the port, busy traffic intersections, restaurants, warehouses, industrial plants and car dealerships.
Sign up for breaking news, reviews, opinion, top tech deals, and more.
"You could use this information when you're picking a school for your kids. Is there a school with a playground that might have better air quality because your kid has asthma?" Apte said.
"This hyper-local information about consistent air quality can be really useful for people, especially those who are vulnerable because of age or health condition."
