How to export data and create a report in Salesforce
Organise customer data and create your Salesforce CRM report in a few easy steps.
One of the reasons Salesforce is a standout CRM brand on our best CRM software list is its powerful reporting function, with detailed data to help you make more informed business decisions. Of course, it's likely part of why your company uses Salesforce which will inevitably lead to the question: how do I export data and create a report in Salesforce?
With a Salesforce CRM creating presentable tables and charts with your most crucial customer data is easy, and even easier to segment for different teams using filters and table editing tools. Simply format, save and export to identify new customer insights or sales trends.
Read on for a step-by-step process of creating reports and exporting data in Salesforce Sales Cloud (Lightning version). We cover everything from the basics like data filters and table columns, plus optional steps that can enrich your analysis, such as chart visualization.
For more product features, head to our Salesforce Service Cloud review.
Salesforce is our pick for medium-size and enterprise businesses – from $25 per user/mo (US-only link)
Salesforce is the CRM software market-leader for good reason: it offers a comprehensive suite of customer relationship tools, excellent integration, and unrivalled customization. Follow this link to find out more.
Read our Salesforce Service Cloud review.
Preparation
How to export data and create a report in Salesforce: Preparation
Reports feed off your Salesforce CRM data, so make sure you upload all the contact data that’s relevant for your business. Sources may include mailing lists from third-party software, sales spreadsheets, and physical business cards. You can use the Import function from the Leads, Accounts, Contacts, or Opportunities tabs.
Next, ensure pipeline items are up to date: for example, check that opportunities have been created for accounts with an interest in your business. As reports can be used to forecast upcoming sales, you should also assign expected revenue and probability figures for each opportunity in your pipeline. This ensures your reporting is current and reliable.
Remove any sample accounts before you begin your report. These are automatically added by Salesforce when you first create your account and may skew your results if not removed.
Sign up for breaking news, reviews, opinion, top tech deals, and more.
Lastly, remove duplicate contacts. Salesforce’s algorithm identifies such cases and offers duplication removal tools, both in individual contact records and through its Duplicate Rules function.
Locate Reports tab
Step 1: Click Reports on the homepage toolbar
Salesforce Sales Cloud opens with a dashboard containing your main sales figures, tasks, and opportunities. On top of these elements, you have a toolbar linking to primary features, such as Leads, Accounts, and Contacts. In this toolbar, click on the Reports tab.
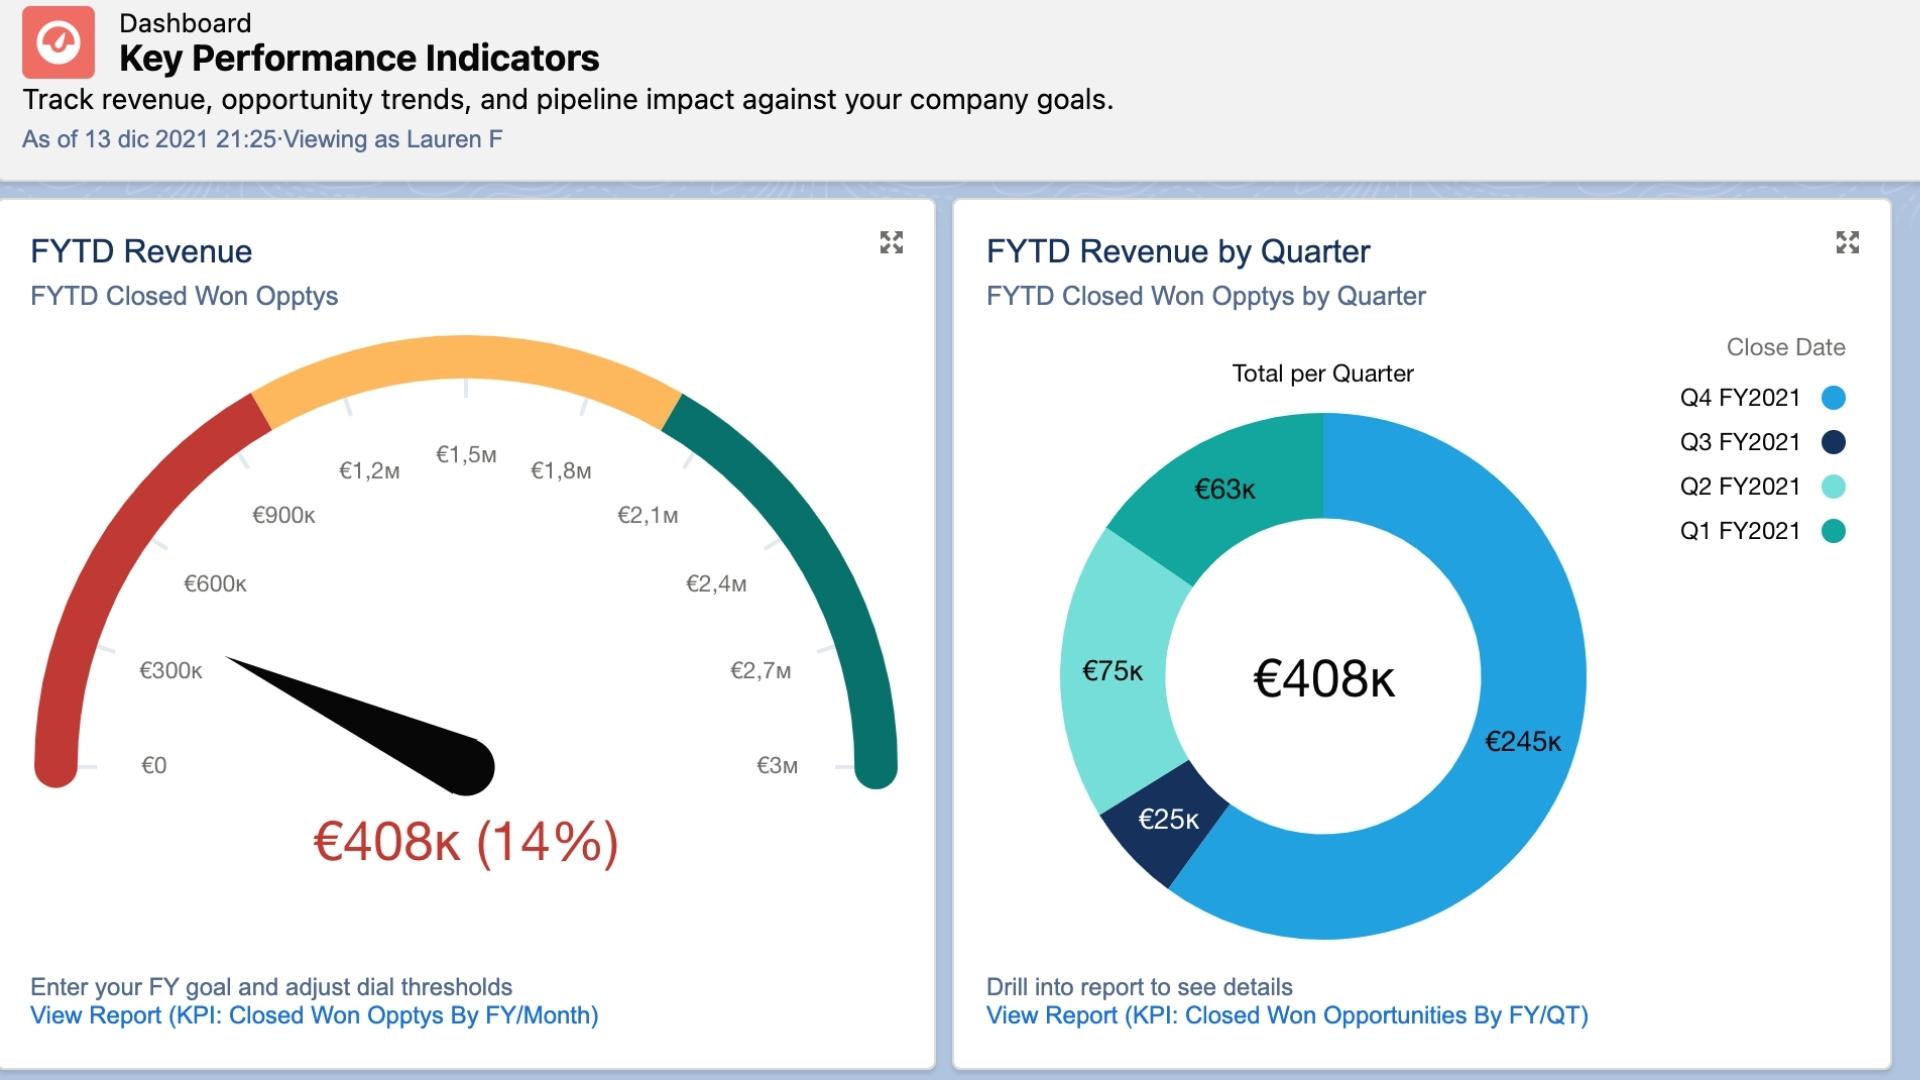
Alternatively, if your homepage is populated with data visualizations, such as your overall sales pipeline, you can click the View Report hyperlink at the bottom of visual elements.
Create a new report
Step 2: Create a new CRM report
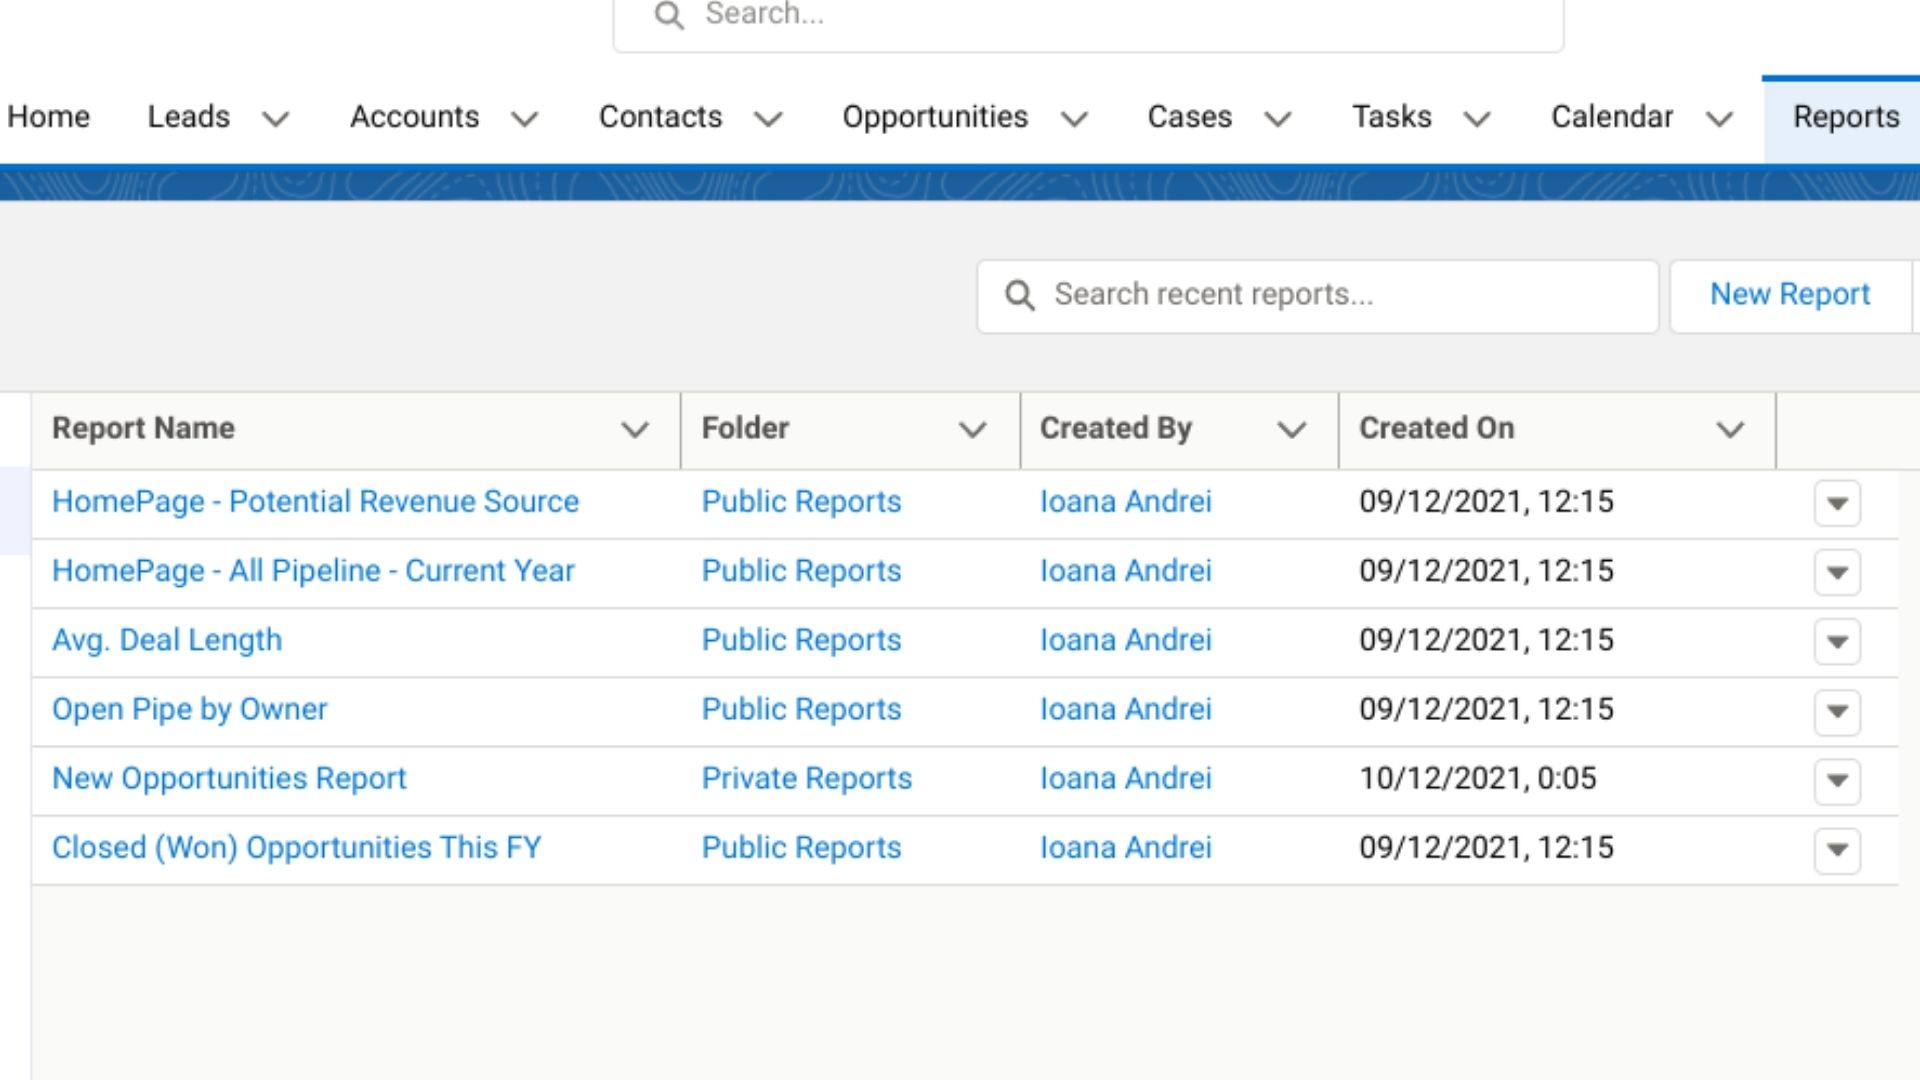
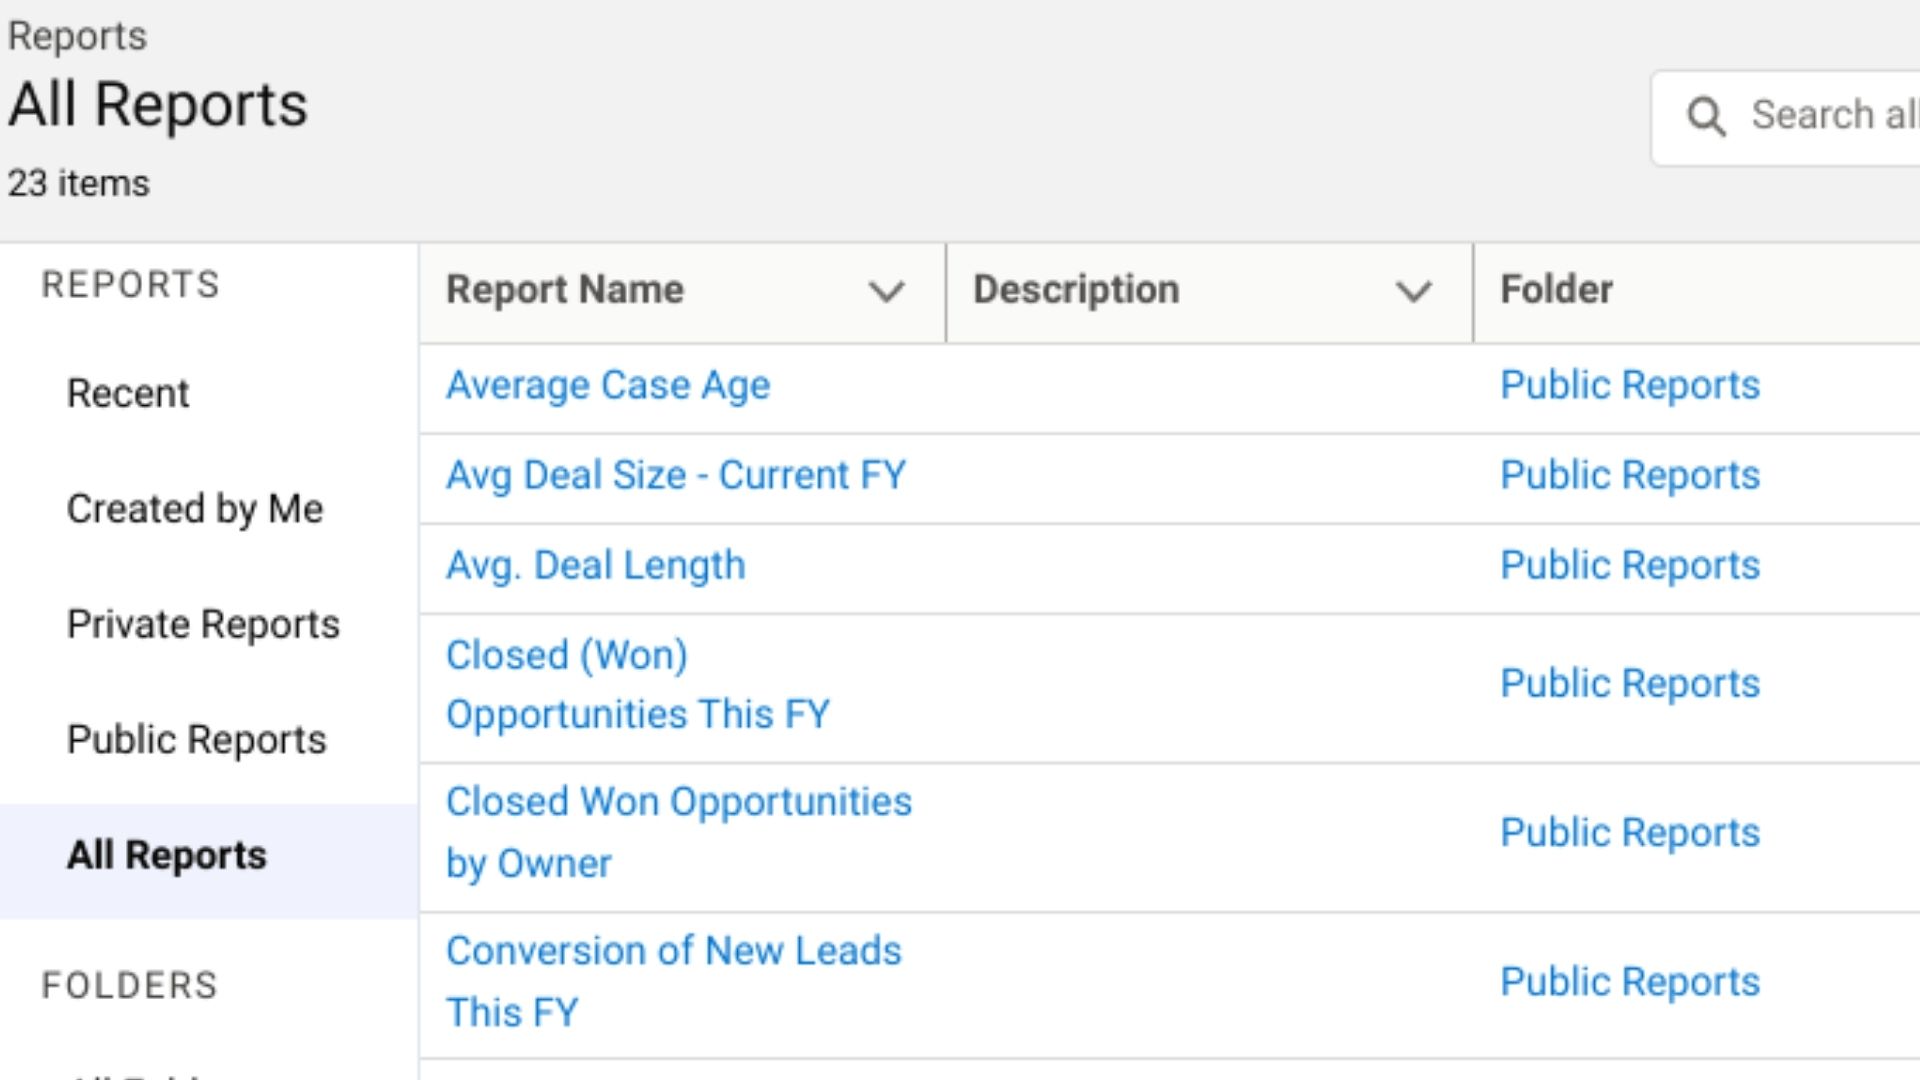
The Reports page opens with a list of recently used reports, by default. If you click on All Reports, on the left-hand side ribbon, you have templates at your disposal, ranging from extensive reports on all pipeline opportunities, to reports zoning in on specific parameters, such as industry, financial year, or opportunity size.
While picking an existing report may save time, it’s worth creating one from scratch if you want data that’s specific to your business. For example, if you’ve created a custom field in your contact records titled Company Tenure, you may want your report to focus on leads with tenure of 10+ years.
To create a new report, click the New Report button on the Reports toolbar, next to the search function.
Choose report type
Step 3: Select report type
The report type window contains your main CRM data categories, including Accounts, Opportunities, and Campaigns, which can help your sales execs and senior management determine your sales funnel’s effectiveness. Categories like Administrative Reports may benefit HR and Operations departments in identifying high-performing staff and sales content.
You can also pick a subcategory to make your report more specific—for example, Opportunities subcategories include Opportunities with Partners and Opportunity History.
Click on a subcategory, or stick to the default report type, and hit Continue.
Apply report filters
Step 4: Select desired filters
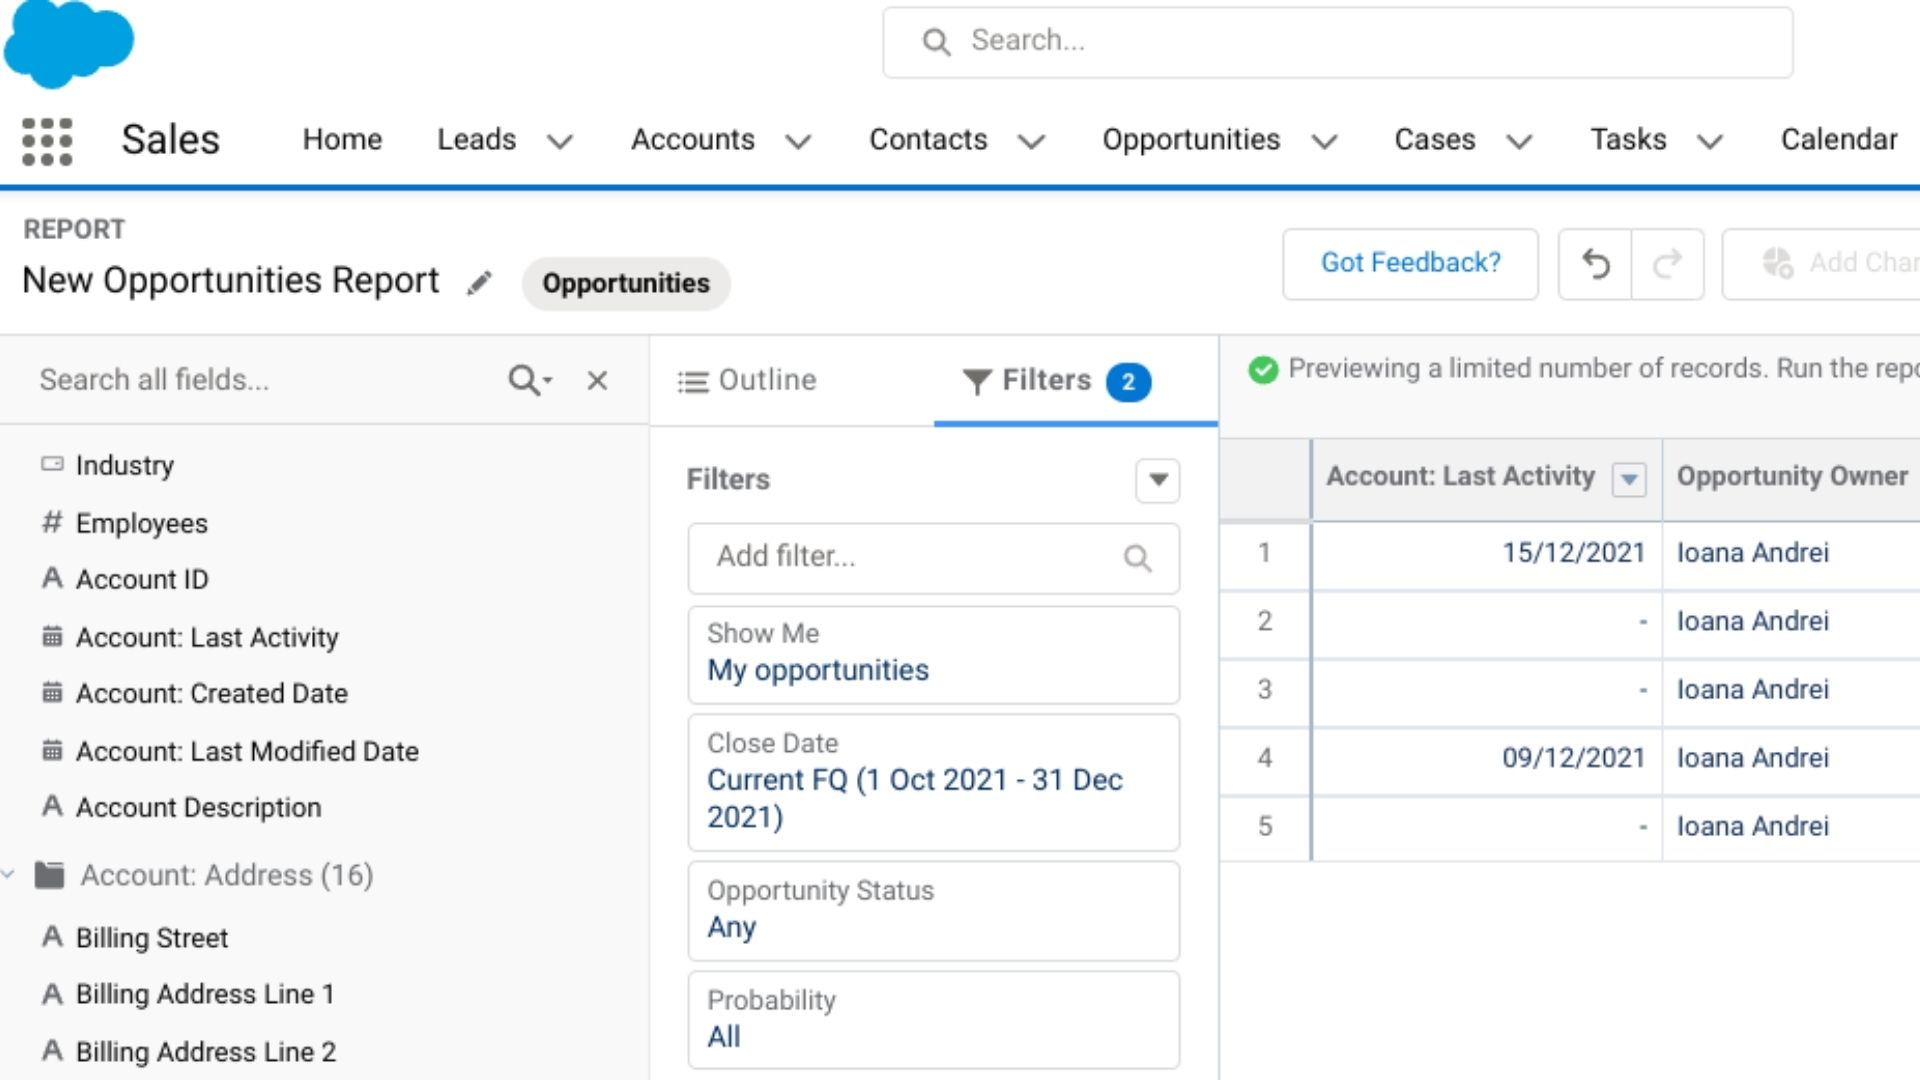
Filters are categories to split your data into, making your report information relevant and concise. You can add as many filters as you want. For example, you can design your Opportunities report to only include closed deals where the lead source is employee referral and amounts are over $100,000.
You should already be in Edit mode. Simply click Filters on the left-hand side ribbon. Here, alter filters from the default list or use the search bar to see more options. Filters will typically have a drop-down menu where you choose the value you want to filter by.
Save your selections by clicking Apply.
Apply report columns
Step 5: Add or remove columns
In Edit mode, your table is pre-populated with columns drawing relevant data for your report type. For instance, an Opportunities report may list account names, deal stage, and win probability.
To add extra columns, go to the Outline tab—next to Filters, on the left-hand side ribbon. Use the search bar to select additional column headers, such as Close Date, Account Type, and Contact Email.
You can remove columns by hitting X next to column headers in the Outline tab or by selecting Remove Column from a column’s dropdown arrow in the report table.
Step 6 (optional): Group rows and columns
Optionally, you can group rows and columns into categories—for instance, Existing Business and New Business— helping ease readability with large tables.
You can add groups just above the Columns section of the Overview tab.
Run report
Step 7: Click Run report
In Edit mode, the Update Preview Automatically function shows real-time filter and column changes, but only applies it to limited line items.
To see the full report after setting up filters and columns, click the Run button on the upper-right corner of the screen.
Optional: Data visualisation
Step 8 (optional): Add chart
Visualizing data can help you gain a sense of proportion or evolution over time, depending on what you’re analyzing.
So, optionally, you could add a chart to your report in Run mode. Simply click on the pie chart icon on the right-hand side toolbar and Salesforce will automatically generate a diagram. To change the chart type and the X and Y axes, click the Settings icon in the upper-right corner of the chart.
Bear in mind that charts organize data based on row and column groups, so you need to first perform Step 7: Group rows and columns to have access to the chart function.
Step 9: Click Save report
By saving the report, the selections you’ve made for filters, columns, rows, and charts are made accessible for future use. As new data comes in—through new contacts or closed deals, for example—your saved report updates accordingly when you open it in Run mode.
You can save reports in either Edit or Run mode by clicking the Save button on the right-hand side toolbar. If it’s a brand new report, you need to provide a title, and, optionally, a description and folder location. Click Save again to finalize.
Export report
Step 10: Click Export report
You may choose to export your report to present your findings to your team or to have a time-stamped copy saved locally to your device or cloud storage.
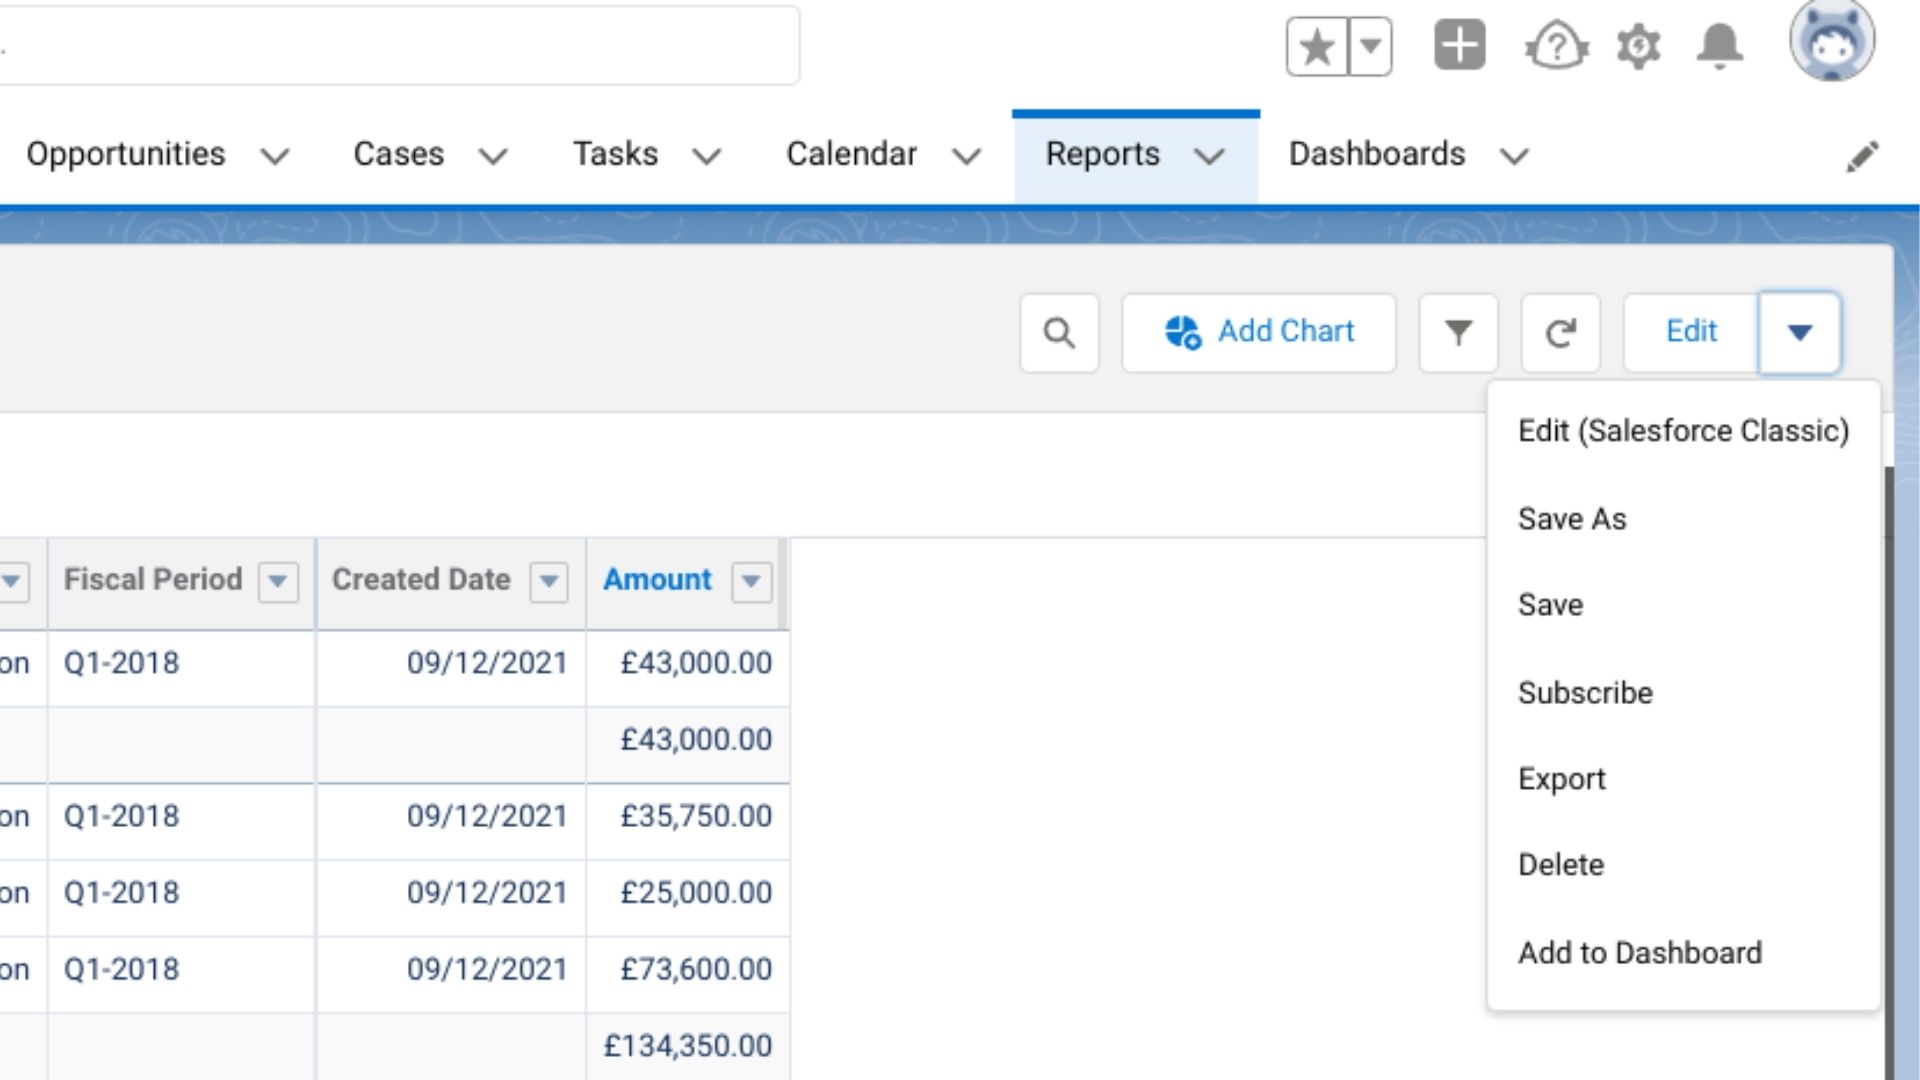
Simply click the dropdown arrow in the far-right corner of the toolbar, and hit Export.
Optionally, you may want to add the report to a dashboard by selecting Add to Dashboard from the dropdown. You’ll be asked to select an existing dashboard or create a new one, give it a description, and make it private or public to the organization.
Step 11: Choose export type
Before downloading your file, you’re asked to choose between Formatted Report and Details Only. The main difference between them is that the Formatted Report can only save as a .xlsx file, while Details Only supports .xls and .csv on top of .xlsx files. Details Only reports save data in a simplified format, making files more import-friendly for third-party software.
For simplicity, select the default option, Formatted Report, and click Export. Your file will save to your default download folder.
If you’re looking to get a PDF copy of your report, Salesforce does not currently support PDF exports. However, many .xls or .csv viewers have the option to save the file as a PDF. Alternatively, read our best Excel to PDF converter guide for more options.
Access saved reports
Step 12: Re-use saved reports
Your saved reports are accessible from the main Reports page, categorized into Recent, Created by Me, Private Reports, Public Reports, and All reports, as well as report folders.
Opening a saved report will automatically run the report, with real-time data. You can edit and re-save an existing report as many times as you like, as per the previous steps. However, if you wish to keep versions separate, you should click Save As, rather than Save.
Summary
So, after preparing your CRM data and following the steps to create, edit, and run your reports, you’re all set for analyzing your business performance on Salesforce and in exported files.
You can now use your reports to understand what makes closed deals successful and how much revenue you can expect over a financial period based on current win rates.
Keen to learn more about Salesforce? Start with our what is Salesforce and what is Salesforce Lightning features. We also cover how to set up Salesforce with Tableau and how to set up Slack to Salesforce integration. Our Salesforce Service Cloud review covers more product features.

Ioana holds a BSc in Business Management from King's College London and has worked for 4+ years as a management consultant in the industries of technology, media and telecoms. Ioana is also a successful entrepreneur, having launched several social enterprises. Writing interests include market research and planning, start-up culture and ethics, agile methodology, and financial modelling. No stranger to tech and hackathons, she is also an accomplished fintech and SaaS writer
