Why you can trust TechRadar
We shoot a specially designed chart in carefully controlled conditions and the resulting images are analysed using DXO Analyzer software to generate the data to produce the graphs below.
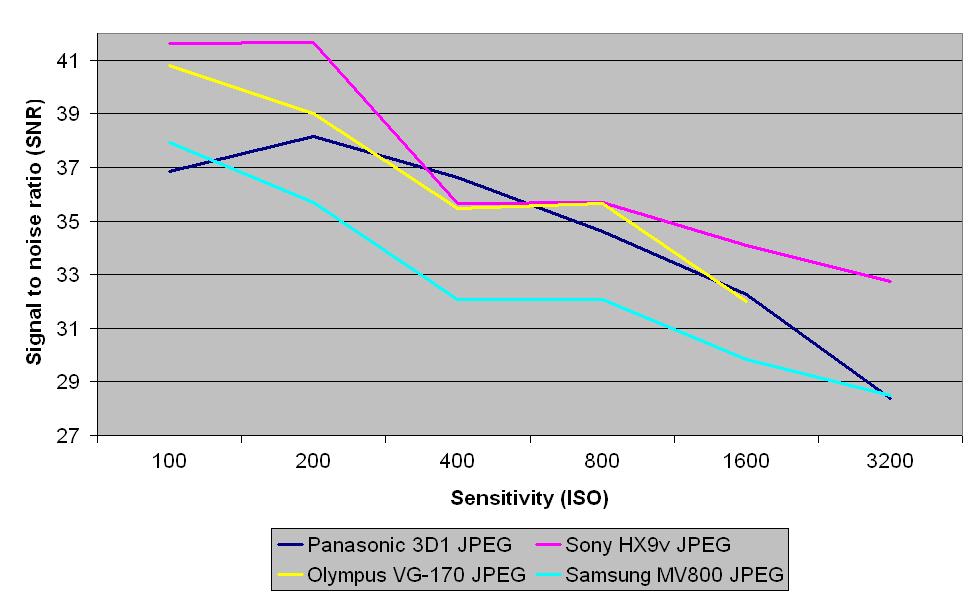
A high signal to noise ratio (SNR) indicates a cleaner and better quality image.
For more more details on how to interpret our test data, check out our full explanation of our noise and dynamic range tests.
JPEG Signal to Noise Ratio

JPEG images from the Panasonic 3D 1 show that it compares well against the Sony HX9v and Olympus VG-170 between sensitivities of ISO 200 and 800, with noise only becoming an issue from ISO 1600.
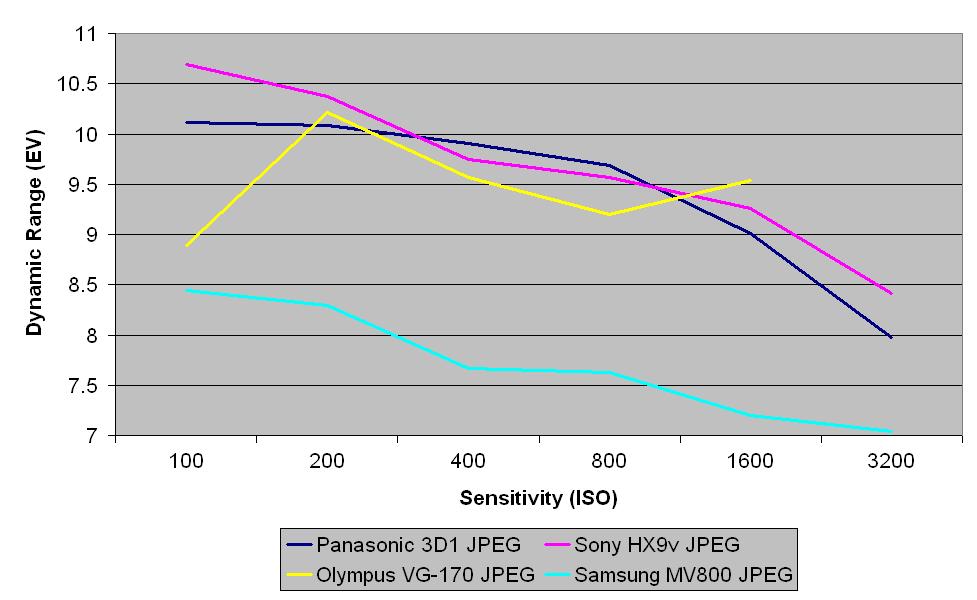
JPEG dynamic range

This chart shows that the Panasonic 3D 1 compares closely with the Sony HX9v and captures a wide tonal graduation in the shadows and highlights up to a sensitivity of ISO 800. Above this sensitivity, although the dynamic range drops, images are still usable.
Sign up for breaking news, reviews, opinion, top tech deals, and more.
Current page: Noise and dynamic range
Prev Page Image quality and resolution Next Page Sample images