RTX 4070 vs 4080: putting Nvidia's latest midrange and high-end cards to the test
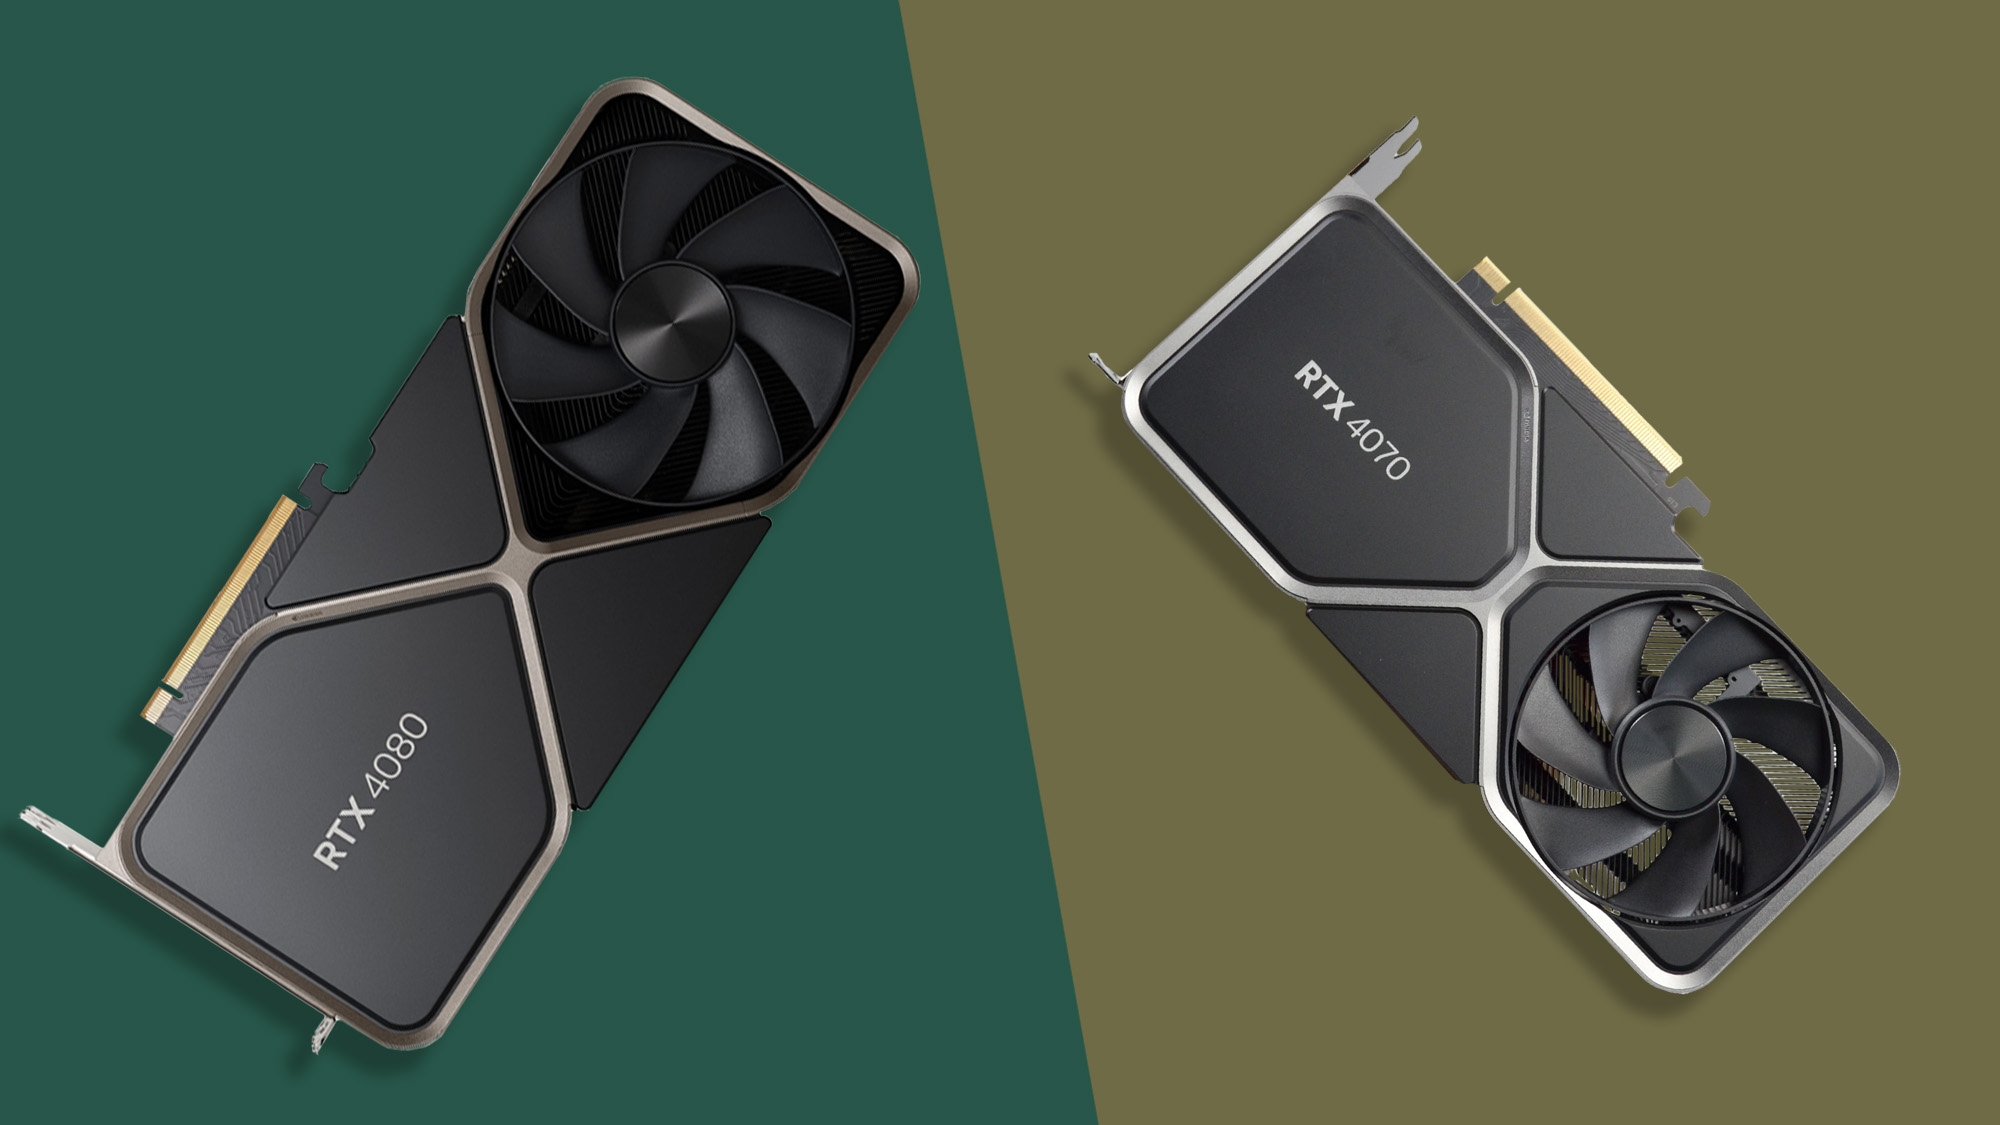
We compare the RTX 4070 and 4080 to help you find your next GPU
Sign up for breaking news, reviews, opinion, top tech deals, and more.
You are now subscribed
Your newsletter sign-up was successful
The RTX 4070 is now on sale, and we're hunting down stock in the US and UK to help you find the card you're looking for. Stay up to date with our Where to buy RTX 4070 live tracker so you don't miss a stock drop in your region.
With the launch of the Nvidia GeForce RTX 4070, there's a new graphics card option on the market for gamers, creators, and everyone in between who needs a powerful GPU for work or gaming.
Without question, the RTX 4070 is possibly the best graphics card for most consumers out there right now, especially for those on a tighter budget who are attracted to the new card's relatively affordable price point.
Between the performance it offers and the inflated prices of competing graphics cards from both AMD and Nvidia, you might think that choosing the RTX 4070 would be an easy decision.
It's not quite that simple, though. The Nvidia GeForce RTX 4080 does exist, after all, and while it definitely isn't our favorite graphics card out there, there's no denying its powerful performance for high-demand workloads like 3D rendering, modeling, and video editing – and that's not even touching on the card's appeal for gamers out there.
For the first time this GPU generation, consumers have a real choice thanks to these two cards; each offers a compelling reason to buy it over the other, with some compromises along the way. To help you figure out which card works best for your situation, we're breaking down the pros and cons of the Nvidia RTX 4070 versus the RTX 4080 to help you choose the GPU that's right for you.
Nvidia RTX 4070 vs RTX 4080: Price
Between the Nvidia RTX 4070 vs RTX 4080, the biggest difference you'll notice right away is the prices for the two cards; or, rather, the massive gap between the two price points.
The Nvidia RTX 4070 has an official MSRP of $599 (about £525 / AU$870), while third-party RTX 4070 cards will sell for more than that. This is a 20% increase in price over the RTX 3070 that launched in 2020, so potential buyers will certainly be turned off by having to chell out extra cash for this card.
Sign up for breaking news, reviews, opinion, top tech deals, and more.
But if you thought a 20% price increase in just a couple of years was bad, you better sit down if you're considering the RTX 4080. With an MSRP of $1,199 (about £1,020 / AU$1,740), the RTX 4070 is an astounding 72% more expensive than the RTX 3080, which has an MSRP of $699 (about £600 / AU$1015).
It's also exactly twice the price of the RTX 4070, so that more than anything should inform your decision making from the jump.
- Winner: Nvidia RTX 4070
Nvidia RTX 4070 vs RTX 4080: Design
As far as design goes, there isn't too much that differentiates the two Founders Edition cards, other than their sizes.
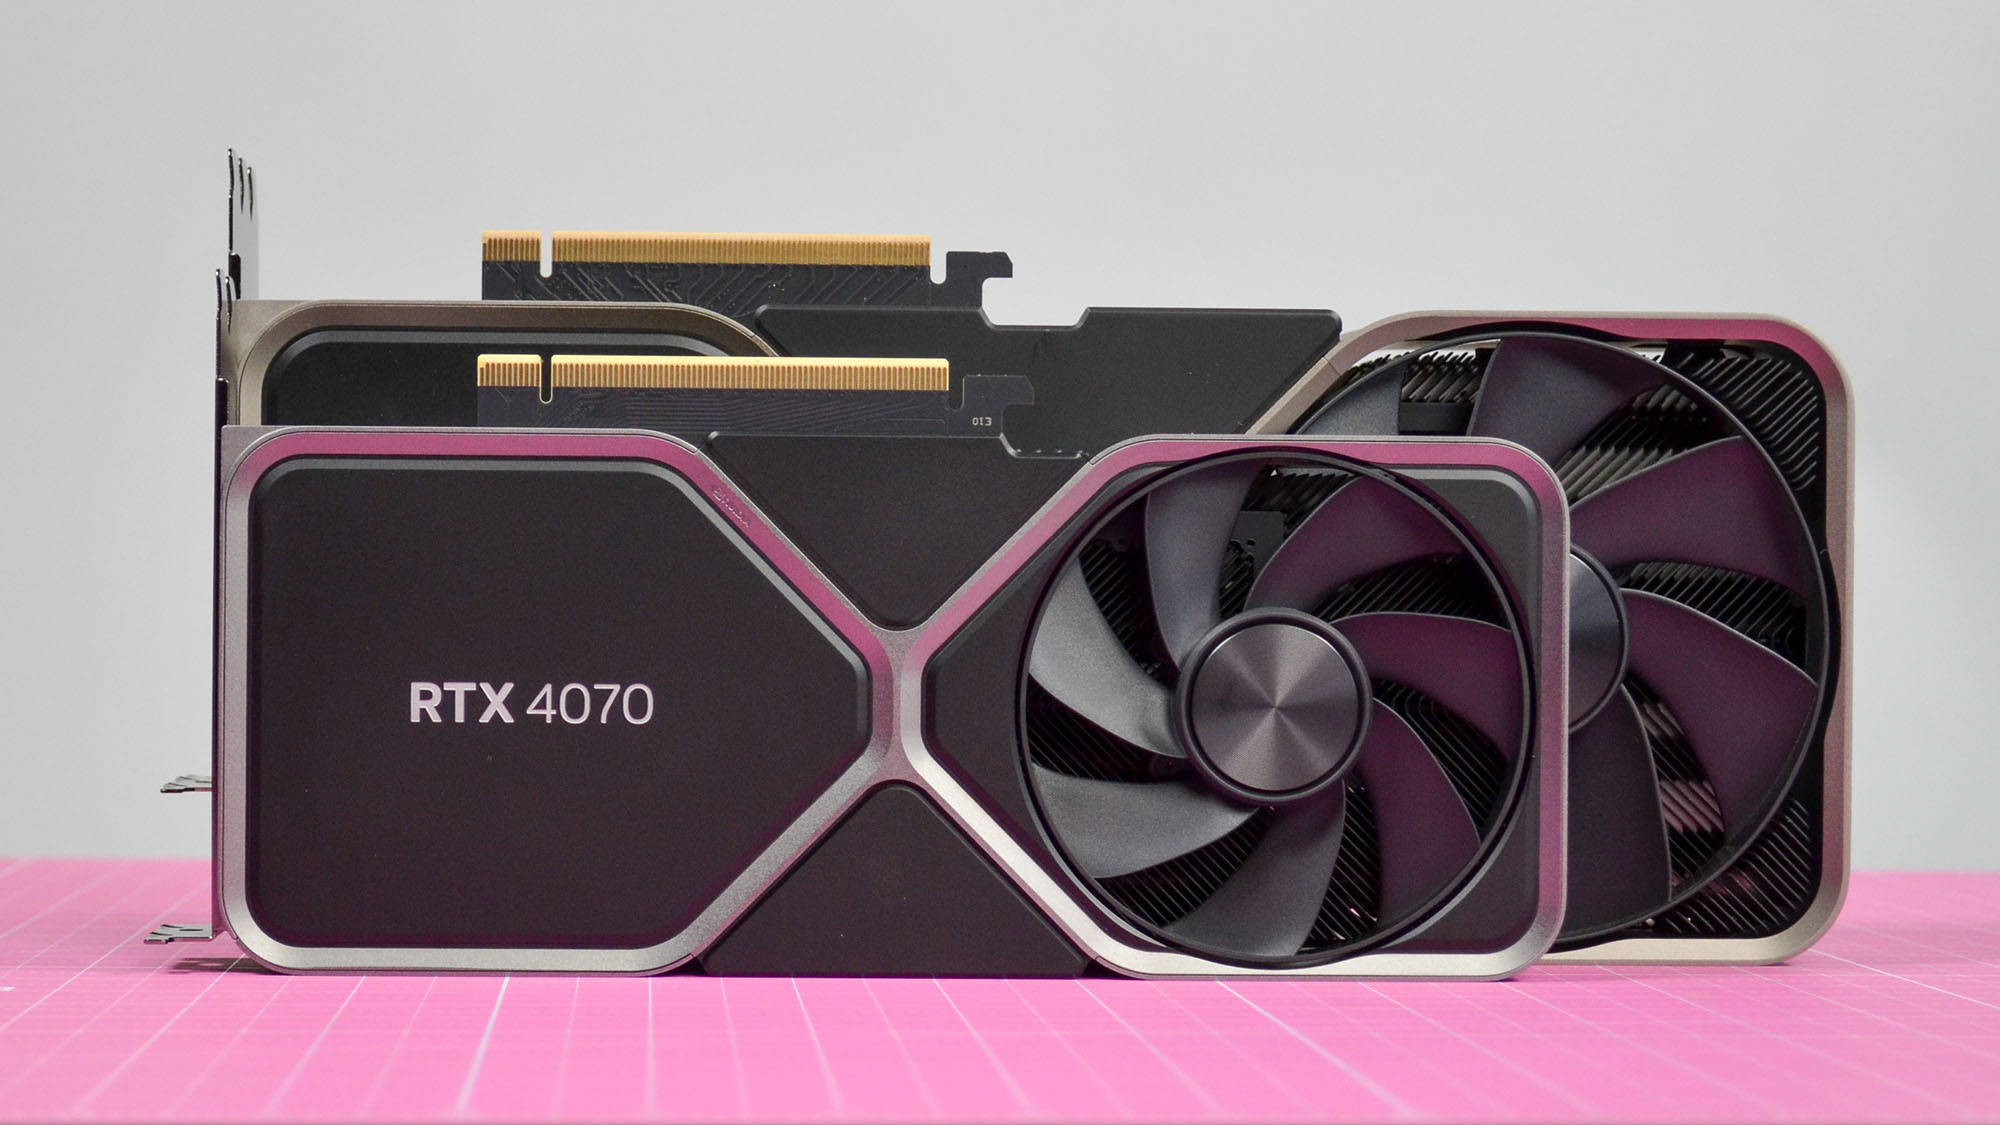
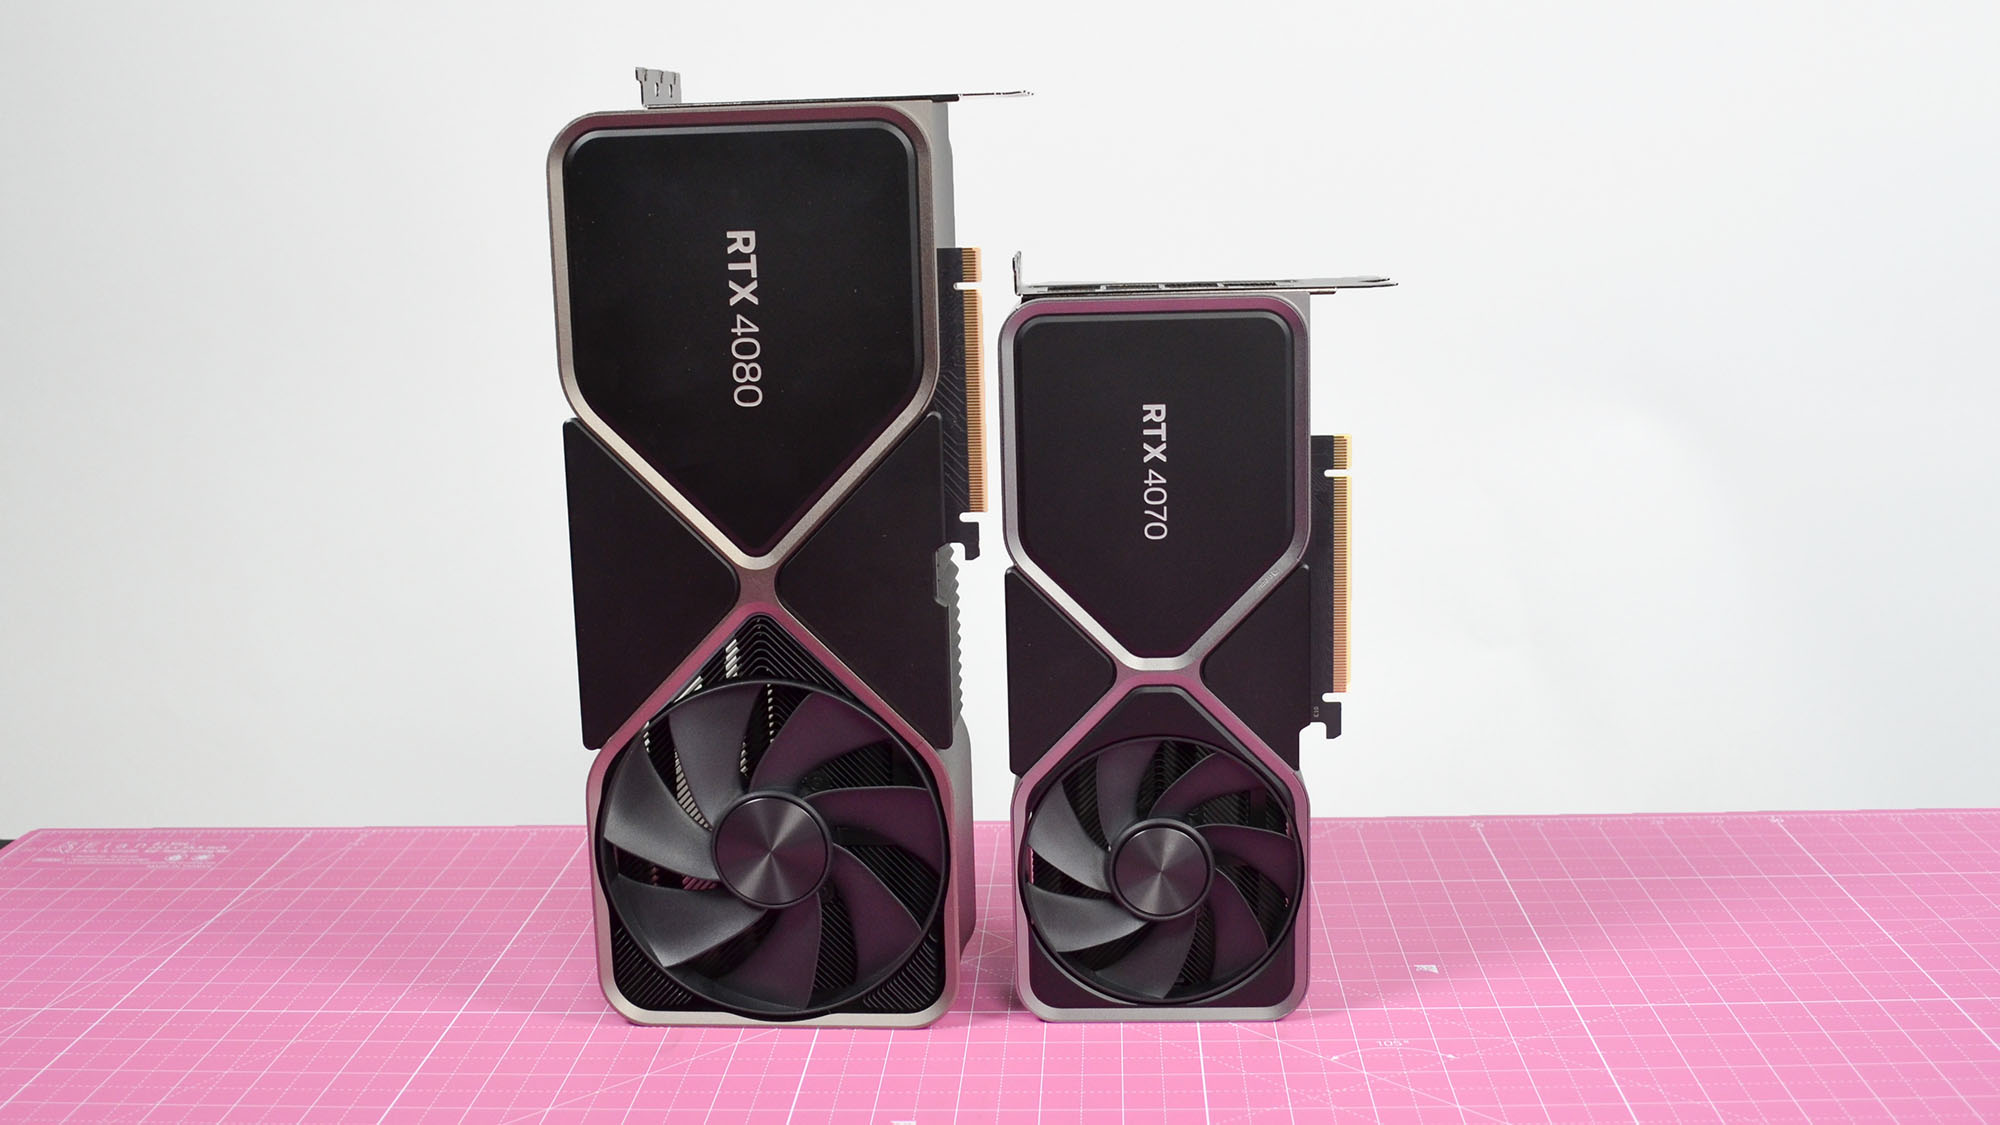
The RTX 4070 is a dual slot card measuring 9.5 inches long by 4.5 inches tall, whereas the RTX 4080 is a triple-slot card measuring a full 12 inches long and 5.4 inches tall. The RTX 4080 also weighs substantially more at 4.66 lbs, compared to the RTX 4070's 2.25 lbs. Put simply, the RTX 4070 is going to be much more easily slotted into your case than the massive RTX 4080.
There is also the matter of the power connector. On both Founders Edition cards, you'll need to plug the card in via a 16-pin 12VHPWR connector, though you'll only need two 8-pin leads to plug into an adapter in the case of the RTX 4070 whereas the RTX 4080 will require you to adapt three 8-pin leads into a single cable. Third-party cards, meanwhile, do not have to use Nvidia's power adapter solution, and can instead opt for the standard 8-pin connections
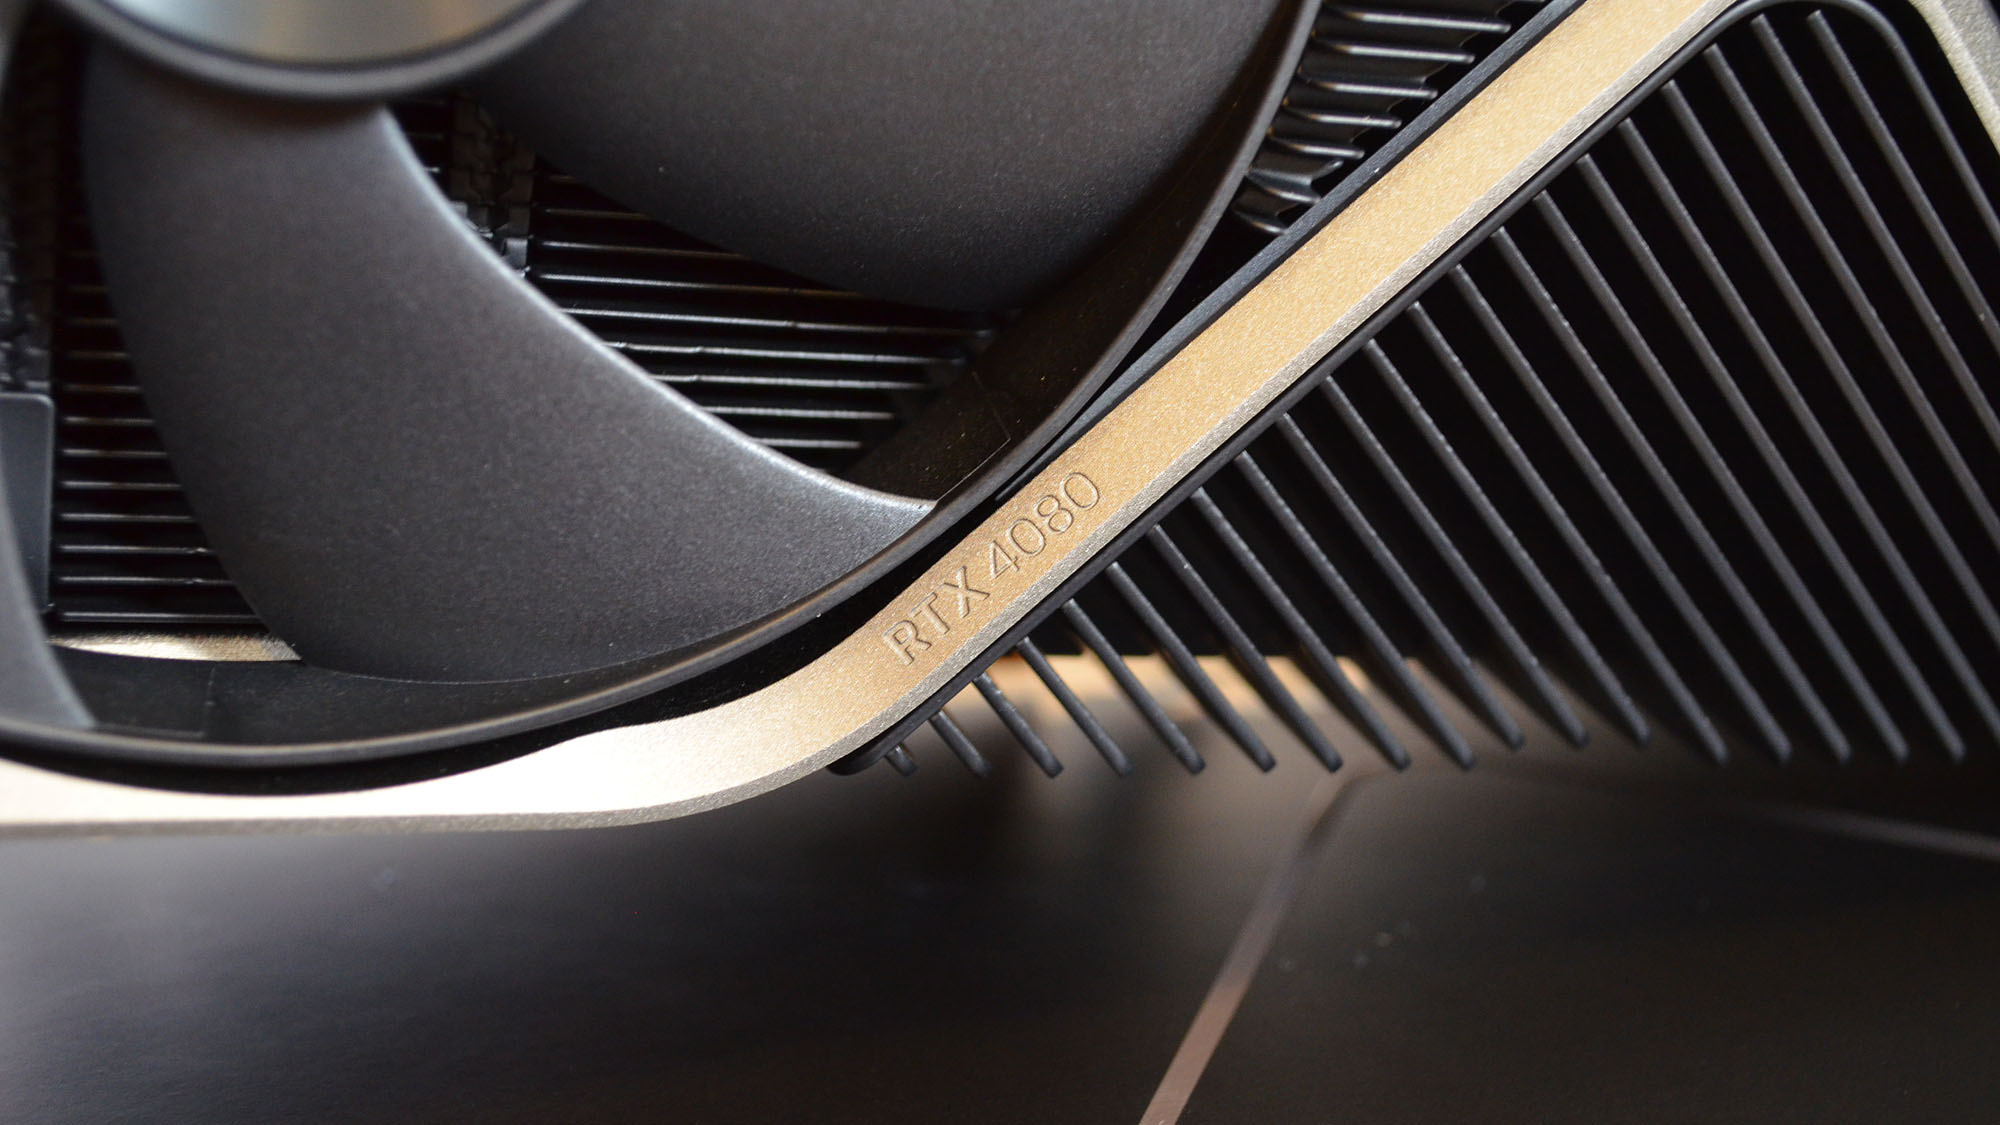
Cooling solutions are also going to vary by manufacturer, but as far as the Founders Edition cards go, they both feature a twin-fan cooling solution, with a fan on the front and back of the card, though the RTX 4080's fans are significantly bigger.
- Winner: Tie
Nvidia RTX 4070 vs RTX 4080: Performance
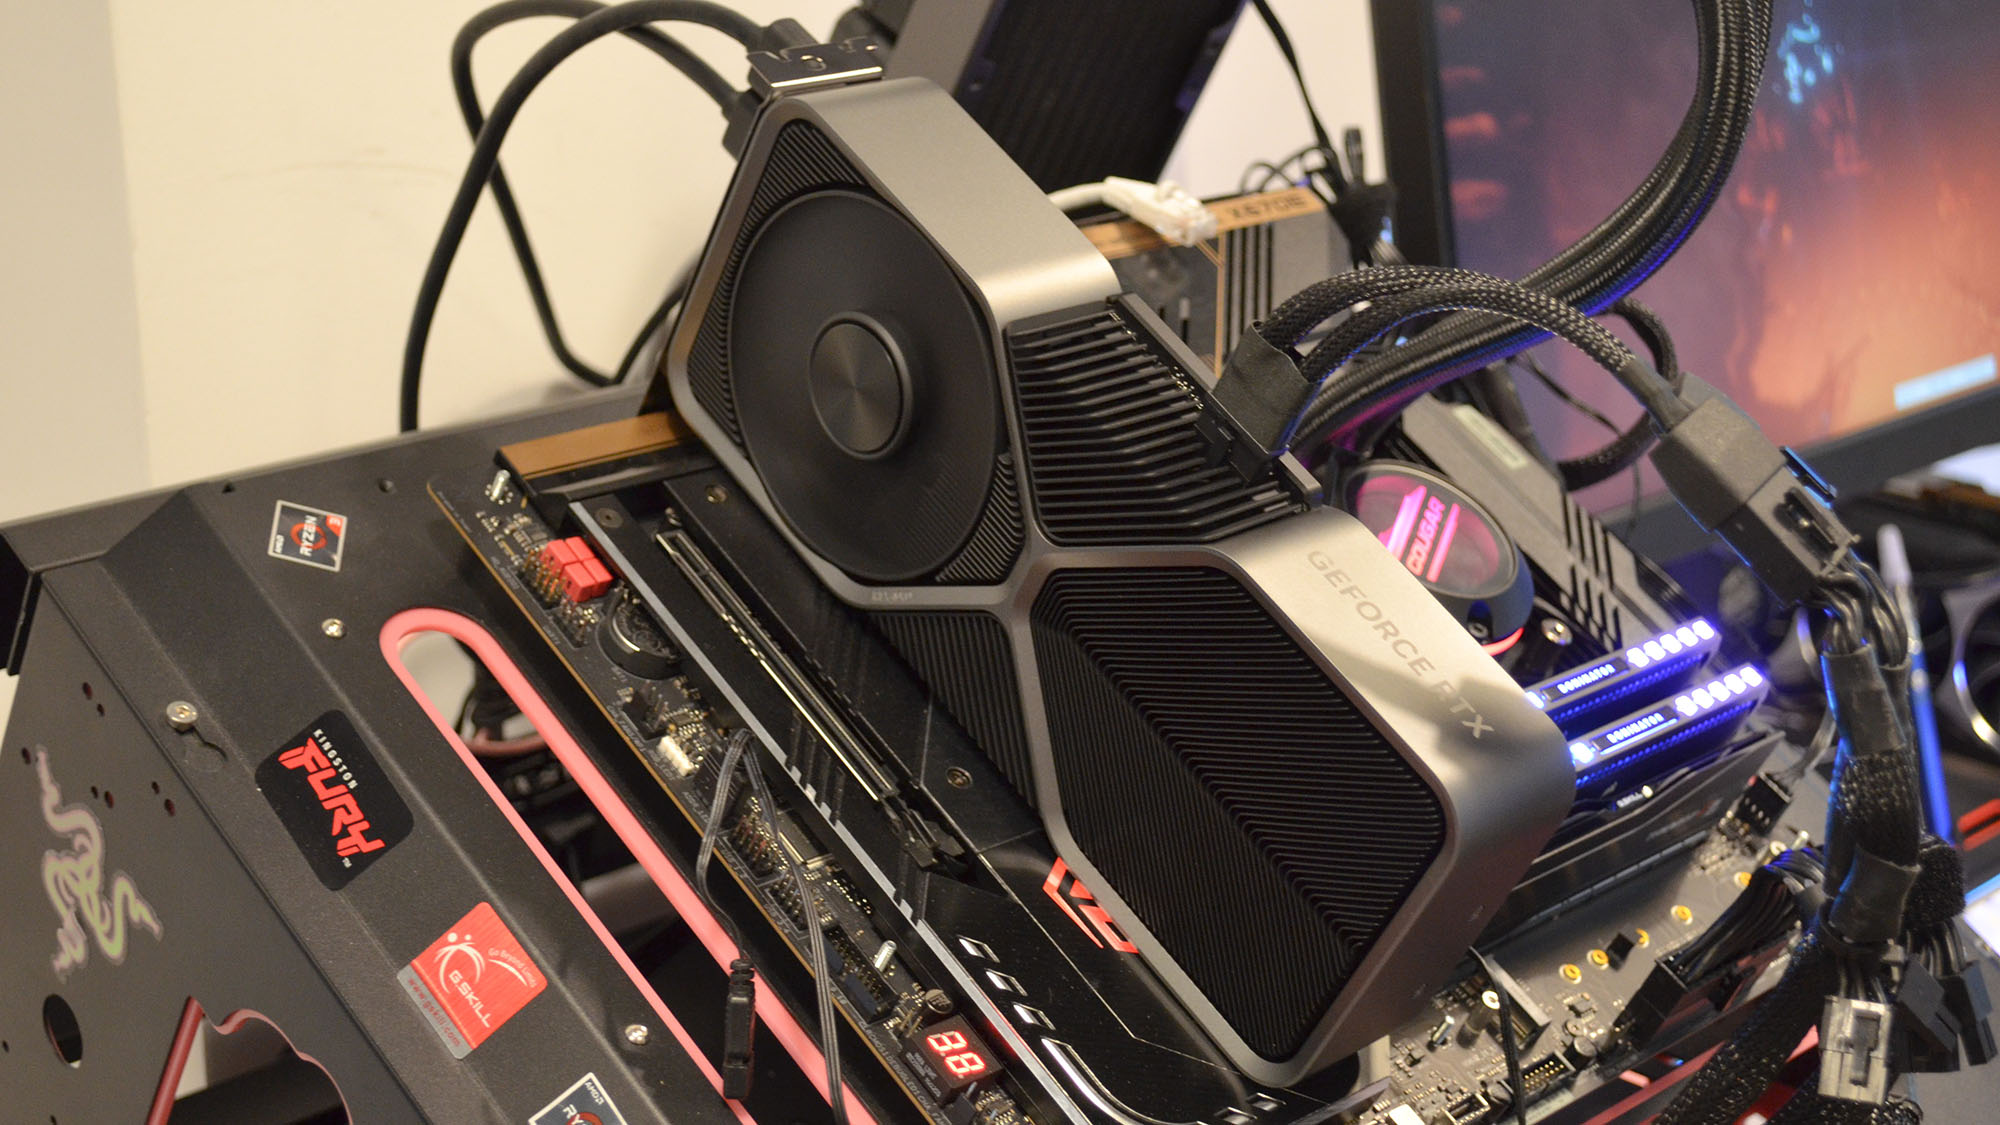
Here is the systems I used to test the Nvidia GeForce RTX 4070 and RTX 4080:
CPU: AMD Ryzen 9 7950X3D
CPU Cooler: Cougar Poseidon GT 360 AIO Cooler
DDR5 RAM: 32GB Corsair Dominator Platinum @ 5,200MHz & 32GB G.Skill Trident Z5 Neo @ 5,200MHz
Motherboard: ASRock X670E Taichi
SSD: Samsung 980 Pro SSD @ 1TB
Power Supply: Corsair AX1000 80-Plus Titanium (1000W) Case: Praxis Wetbench
At the end of the day, you're going to need your new card to do some pretty heavy lifting, so a card's performance is understandably going to be the most important consideration for just about everybody.
Fortunately, I've spend probably close to 100 hours at my unofficially official TechRadar TestBench™ putting both of these cards through their paces for the past few weeks, so I've gathered a lot of data that really helps illuminate what you can expect from these two cards.
Starting with general synthetic performance using 3DMark and PassMark DirectX tests, we can see that the RTX 4080 is substantially more powerful than the RTX 4070.
| Header Cell - Column 0 | RTX 4070 | RTX 4080 | Performance Difference |
|---|---|---|---|
| 3DMark Firestrike (1080p) | 44,288 | 51,767 | 16.89% |
| 3DMark Nightraid (1080p) | 179,557 | 187,421 | 4.38% |
| 3DMark Speedway (1440p) | 4,454 | 7,179 | 61.20% |
| 3DMark Port Royal (1440p) | 11,154 | 17,910 | 60.57% |
| 3DMark Time Spy (1440p) | 17,778 | 24,863 | 39.86% |
| 3DMark Firestrike Extreme (1440p) | 21,482 | 32,251 | 50.13% |
| 3DMark Time Spy Extreme (2160p) | 8,541 | 14,085 | 64.91% |
| 3DMark Firestrike Ultra (2160p) | 10,037 | 17,379 | 73.15% |
| 3DMark Wildlife Extreme (2160p) | 36,008 | 60,076 | 66.84% |
| 3DMark Wildlife Extreme Unlimited (2160p) | 35,343 | 59,676 | 68.85% |
| PassMark 3D DirectX Test | 34,913 | 43,558 | 24.76% |
| Row 12 - Cell 0 | Row 12 - Cell 1 | Row 12 - Cell 2 | Row 12 - Cell 3 |
| Row 13 - Cell 0 | Row 13 - Cell 1 | Row 13 - Cell 2 | Row 13 - Cell 3 |
| Average Synthetic Performance | 36,687 | 46,924 | 27.91% |
You don't buy a new graphics card just to run synthetic tests on them, which makes real-world performance tests for creative workloads and gaming much more important and indeed relevant that anything 3DMark or PassMark can come up with.
| Header Cell - Column 0 | RTX 4070 | RTX 4080 | Performance Difference |
|---|---|---|---|
| V-Ray 5 CUDA | 1,871 | 3,094 | 65.34 % |
| V-Ray 5 RTX | 2,629 | 4,150 | 57.84% |
| Lumion 12.5 1080p@60 fps, draft quality | 7,176 frames/hr | 6,730 frames/hr | -6.21% |
| Lumion 12.5 1080p@60 fps, production quality | 730 frames/hr | 733 frames/hr | 0.41% |
| Lumion 12.5 2160p@60 fps, production quality | 264 frames/hr | 266 frames/hr | 0.76% |
| Lumion 12.5 8K image render, production quality | 42 frames/hr | 63 frames/hr | 50.88% |
| Handbrake 4K to 1080p GPU encode | 170 frames/sec | 177 frames/sec | 4.32% |
| Row 7 - Cell 3 | |||
| Row 8 - Cell 0 | Row 8 - Cell 1 | Row 8 - Cell 2 | Row 8 - Cell 3 |
| Average Creative Performance | 1,587 | 2,245 | 41.45% |
Finally, there's the matter of gaming, which is where these two graphics cards are really oriented towards (if you're looking for a creator GPU but don't want to invest several thousand dollars on a workstation GPU, the Nvidia GeForce RTX 4090 is definitely your best bet, just be prepared to pay the premium for that kind of performance).
| Header Cell - Column 0 | RTX 4070 | RTX 4080 | Performance Difference |
|---|---|---|---|
| 1080p fps | Avg | Min (1%) | Avg | Min (1%) | Avg | Min (1%) |
| Metro: Exodus | 73 | 46 | 174 | 81 | 138.36% | 76.09% |
| F1 2022 | 259 | 230 | 317 | 266 | 22.39% | 15.65% |
| Total War: Warhammer III | 136 | 100 | 201 | 157 | 48.01% | 57.0% |
| Cyberpunk 2077 | 85 | 69 | 133 | 99 | 56.47% | 43.48% |
| Returnal | 131 | 76 | 198 | 99 | 51.15% | 30.26% |
| Tiny Tina's Wonderland | 156 | 124 | 240 | 189 | 53.85% | 52.42% |
| Counterstrike: Global Offensive | 722 | 804 | 11.42% |
| Row 9 - Cell 0 | Row 9 - Cell 1 | Row 9 - Cell 2 | Row 9 - Cell 3 |
| Average Native 1080p, Non-RT Performance | 143 | 111 | 291 | 156 | 103.27% | 40.70% |
| Header Cell - Column 0 | RTX 4070 | RTX 4080 | Performance Difference |
|---|---|---|---|
| 1440p fps | Avg | Min (1%) | Avg | Min (1%) | Avg | Min (1%) |
| Metro: Exodus | 77 | 47 | 153 | 76 | 98.7% | 61.7% |
| F1 2022 | 204 | 170 | 276 | 238 | 35.29% | 40.0% |
| Total War: Warhammer III | 91 | 64 | 143 | 109 | 57.14% | 70.31% |
| Cyberpunk 2077 | 48 | 37 | 82 | 63 | 70.83% | 70.27% |
| Returnal | 101 | 65 | 151| 73 | 49.5% | 12.31% |
| Tiny Tina's Wonderland | 107 | 91 | 171 | 137 | 59.81% | 50.55% |
| Counterstrike: Global Offensive | 479 | 619 | 29.27% |
| Row 9 - Cell 0 | Row 9 - Cell 1 | Row 9 - Cell 2 | Row 9 - Cell 3 |
| Average Native 1080p, Non-RT Performance | 105 | 80 | 221 | 119 | 110.57% | 49.02% |
| Header Cell - Column 0 | RTX 4070 | RTX 4080 | Performance Difference |
|---|---|---|---|
| 2160p fps | Avg | Min (1%) | Avg | Min (1%) | Avg | Min (1%) |
| Metro: Exodus | 33 | 21 | 103 | 60 | 212.12% | 185.71% |
| F1 2022 | 136 | 116 | 192 | 160 | 41.18% | 37.93% |
| Total War: Warhammer III | 47 | 33 | 75 | 56 | 60.0% | 69.7% |
| Cyberpunk 2077 | 19 | 15 | 37 | 27 | 94.74% | 80.0% |
| Returnal | 59 | 39 | 93 | 62 | 57.63% | 58.97% |
| Tiny Tina's Wonderland | 56 | 47 | 91 | 75 | 62.5% | 59.57% |
| Counterstrike: Global Offensive | 224 | 365 | 62.75% |
| Row 9 - Cell 0 | Row 9 - Cell 1 | Row 9 - Cell 2 | Row 9 - Cell 3 |
| Average Native 1080p, Non-RT Performance | 58 | 45 | 131 | 74 | 127.06% | 64.97% |
Regardless of the benchmarks run, the RTX 4080 absolutely outclasses the RTX 4070 in native (not upscaled) 1080p and 1440p non-ray-traced gaming, easily doubling the RTX 4070's average fps at 1080p,1440p, and 4k gaming.
| Header Cell - Column 0 | RTX 4070 | RTX 4080 | Performance Difference |
|---|---|---|---|
| 1080p fps | Avg | Min (1%) | Avg | Min (1%) | Avg | Min (1%) |
| Metro: Exodus | 73 | 46 | 174 | 81` | 212.12% | 185.71 |
| F1 2022 | 127 | 108 | 193 | 155 | 57.65 | 57.53% |
| Cyberpunk 2077 | 57 | 44 | 90 | 68 | 57.89% | 54.55% |
| Returnal | 109 | 63 | 166 | 71 | 52.29% | 12.70% |
| Row 6 - Cell 0 | Row 6 - Cell 1 | Row 6 - Cell 2 | Row 6 - Cell 3 |
| Average Native 1080p, RT Performance | 93 | 65 | 148 | 92 | 60.0% | 40.61% |
| Header Cell - Column 0 | RTX 4070 | RTX 4080 | Performance Difference |
|---|---|---|---|
| 1440p fps | Avg | Min (1%) | Avg | Min (1%) | Avg | Min (1%) |
| Metro: Exodus | 59 | 38 | 166 | 65 | 181.36% | 71.05% |
| F1 2022 | 85 | 73 | 134 | 115 | 57.65% | 57.53% |
| Cyberpunk 2077 | 35 | 27 | 58 | 44 | 65.71% | 62.96 |
| Returnal | 76 | 54 | 121 | 77 | 59.21% | 42.59% |
| Row 6 - Cell 0 | Row 6 - Cell 1 | Row 6 - Cell 2 | Row 6 - Cell 3 |
| Average Native 1440p, RT Performance | 64 | 48 | 120 | 75 | 87.84% | 56.77% |
| Header Cell - Column 0 | RTX 4070 | RTX 4080 | Performance Difference |
|---|---|---|---|
| 2160p fps | Avg | Min (1%) | Avg | Min (1%) | Avg | Min (1%) |
| Metro: Exodus | 17 | 13 | 65 | 44 | 282.35% | 238.46% |
| F1 2022 | 48 | 40 | 72 | 61 | 50.0% | 52.50% |
| Cyberpunk 2077 | 15 | 8 | 28 | 22 | 86.67% | 175.0% |
| Returnal | 52 | 30 | 68 | 41 | 30.77% | 36.67% |
| Row 6 - Cell 0 | Row 6 - Cell 1 | Row 6 - Cell 2 | Row 6 - Cell 3 |
| Average Native 1080p, Non-RT Performance | 34 | 25 | 60 | 44 | 74.85% | 79.67% |
Cranking the ray tracing up to max, you're definitely going to take a major performance penalty with the RTX 4070, losing about 38fps on average. Since the RTX 4070 is starting off just shy of cracking 60fps at 4K, turning on ray tracing effectively makes games unplayable with an average 34fps and an fps floor of 25fps. The situation is better at 1440, where the RTX 4070 averages 64fps with max ray tracing, with an fps floor of 48, which is definitely playable. At 1080p, you're looking at a floor of 65fps on average with ray tracing maxed out, so 1080p is really the only resolution that the RTX 4070 will give you solid ray tracing performance (with an average fps of 93, to boot).
The RTX 4080, meanwhile, gets nearly 70% better ray tracing performance across every resolution, with a native 4K average fps of 60 and a minimum fps floor of 44, which is again playable, if not fantastic.
But, as powerful as these cards are, their best feature is DLSS, which pretty much recovers all the fps you lose with ray tracing, especially when setting DLSS to Ultra Performance mode rather than Quality. With DLSS, the RTX 4070 is able to maintain a minimum fps of 60 at 4K with every setting maxed along with ray tracing. The RTX 4080, meanwhile, is getting close to maintaining a 100 fps minimum framerate with DLSS and ray tracing turned on at 4K.
Overall, across all these metrics, the Nvidia RTX 4080 outperforms the RTX 4070 by about 65% when it comes to gaming, which is massive. This is the difference between having the best gaming monitor running at 4K and 144Hz and actually being able to take advantage of that extra monitor refresh and not seeing any benefit at all.
That said, you really do have to ask yourself whether 65% better performance is worth paying double to get the RTX 4080 over the RTX 4070, but if money isn't your concern, then the RTX 4080 is definitely the better card out of the two across ever performance metric.
- Winner: Nvidia RTX 4080
Which one should you buy?
When it comes to the Nvidia RTX 4070 vs the RTX 4080, you have a really good reason to go either way.
If you are more concerned about getting the best value for your investment, then the Nvidia RTX 4070 is the way to go. Not only is it a very competent 4K graphics card, it's arguably the best 1440p graphics card you can get and even with the 20% price hike, it's the most affordable next-gen card you can buy.
Still, the RTX 4070 is a 1440p graphics card at its core, and it's meant to strike a middle ground rather than go whole hog on performance. For that, you have the RTX 4080, which frankly runs circles around the RTX 4070 when it comes to gaming. You have to swallow the premium that comes with all that performance, but if you're willing to do so (and the RTX 4090 is just a step too far for you), then the RTX 4080 is the card you'll want.
Which ever you end up with though, you're sure to be satisfied, as these are two of the best Nvidia GeForce graphics cards Team Green has ever produced.

John (He/Him) is the Components Editor here at TechRadar and he is also a programmer, gamer, activist, and Brooklyn College alum currently living in Brooklyn, NY.
Named by the CTA as a CES 2020 Media Trailblazer for his science and technology reporting, John specializes in all areas of computer science, including industry news, hardware reviews, PC gaming, as well as general science writing and the social impact of the tech industry.
You can find him online on Bluesky @johnloeffler.bsky.social