From extended boot times to lengthy application launches and slow shutdowns, Windows is prone to all kinds of performance issues. If you're an experienced PC user then you'll know that the Task Manager and Event Viewer can offer help in diagnosing the problem, but that's about it. Anything more complicated and you're on your own.
It doesn't have to be that way – not if you install Microsoft's free Windows Performance Toolkit. This troubleshooting utility can record exactly what's happening on your PC, then produce detailed reports revealing the resource hogs that are holding it back – the key information you need to get your system running optimally.
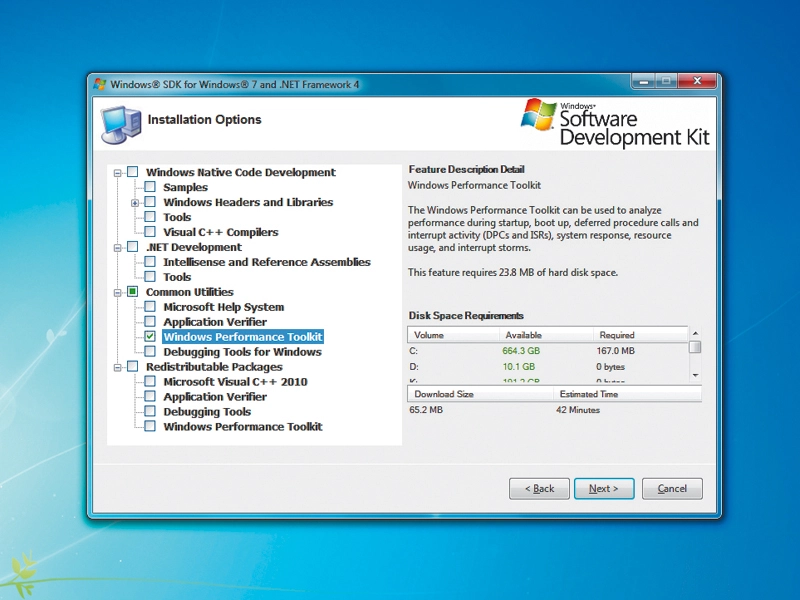
Article continues belowDespite its name, the tool installs and runs happily on Vista as well. Head to the download page and grab the web installer. Launch this and you should get a choice of the components you'd like to install. Check 'Windows Performance Toolkit' in the 'Common Utilities' section (if you don't see that, check 'Win32 Development Tools') and allow the program to download and install your selected files.

To see this in action, click 'Start', type cmd, right-click 'cmd.exe' and select 'Run as administrator'. Click inside the window, type xperf -on DiagEasy and press [Enter].
The Toolkit starts monitoring your PC immediately, so do something that needs a lot of resources, such as load a game, then close it again. When you've finished, switch back to the command window, type xperf -d trace.etl and press [Enter]. Once the file has been written to disk, you're ready to analyse the results.
Analysis
Type xperf trace.etl and press [Enter], or double-click the 'trace. etl' file in Explorer to see what it contains. (It'll be saved in the current command line folder – probably 'Windows\System32'). You'll find a window containing many graphs, each detailing some aspect of what was happening during the monitoring process.
The 'Process lifetimes' graph, for instance, shows you which processes were running and active. The 'Disk I/O' and 'Disk utilisation' graphs describe aspects of your hard drive usage, and there's a host of charts showing how your CPU was used during the monitoring period.
Click 'Graphs', select 'Disk utilisation by process' and a new graph will appear. Choose the 'Processes' box within the graph, clear 'All processes' and the graph will clear. Now check one or more individual processes and you'll see their hard drive use plotted on the graph. This is very useful if you want to pick out one resource hog from amid everything else.

Selecting 'Graphs | CPU usage by process' does much the same thing for processor use. In just a few clicks you can identify which processes were making regular demands on your CPU during the monitoring period. If these include background apps you don't need, close them down to improve your PC's performance.
It's even possible to overlay one chart over another. The 'Process lifetimes' chart, for instance, only shows you running programs, but if you right-click within the chart and select 'Overlay graph | Disk utilisation | All', for example, the 'Process lifetimes' data will appear on top of the 'Disk utilisation' spikes so you can see how hard drive use changes as programs are launched.

If this is too vague for your liking, right-click within any chart and choose one of its 'Summary table' options. You'll then be shown a table containing the raw data within the graph.
Startup and shutdown
If your PC seems slow, monitoring it with the Windows Performance Toolkit may show what's grabbing your resources. The toolkit isn't just for occasional use, though. It also has day-to-day applications, such as monitoring your PC's startup and shutdown process, and again pointing the finger at what might be slowing it down.
To try this, you need to launch a separate utility, but remember that this will have to reboot your PC to launch its tests. Having too many apps open will distort the analysis it produces, so close everything with a button on the taskbar, but not background tasks with icons in the system tray.
Open an elevated command line, type xbootmgr.exe -trace boot and press [Enter]. Your PC will shut down and reboot twice. You may see status messages from xbootmgr, such as 'waiting for prefetcher'.
Eventually, xbootmgr will display a 'Delay' message with a countdown timer. This is because the program doesn't know exactly when you want the boot analysis to finish. Wait for any bulky background programs to launch, then click 'Finish' when you're happy and allow xbootmgr to reboot again if it asks.
When the process is over, look in 'Windows\System32' for new '.etl' files (or search your PC for boot*.ETL and shutdown*.etl files if you have trouble finding them; ours were called 'boot_ BASE+CSWITCH_1.etl' and 'shutdown_BASE+CSWITCH_1. etl').
Double-click whatever you find to take a closer look at the startup and shutdown process.