Why you can trust TechRadar
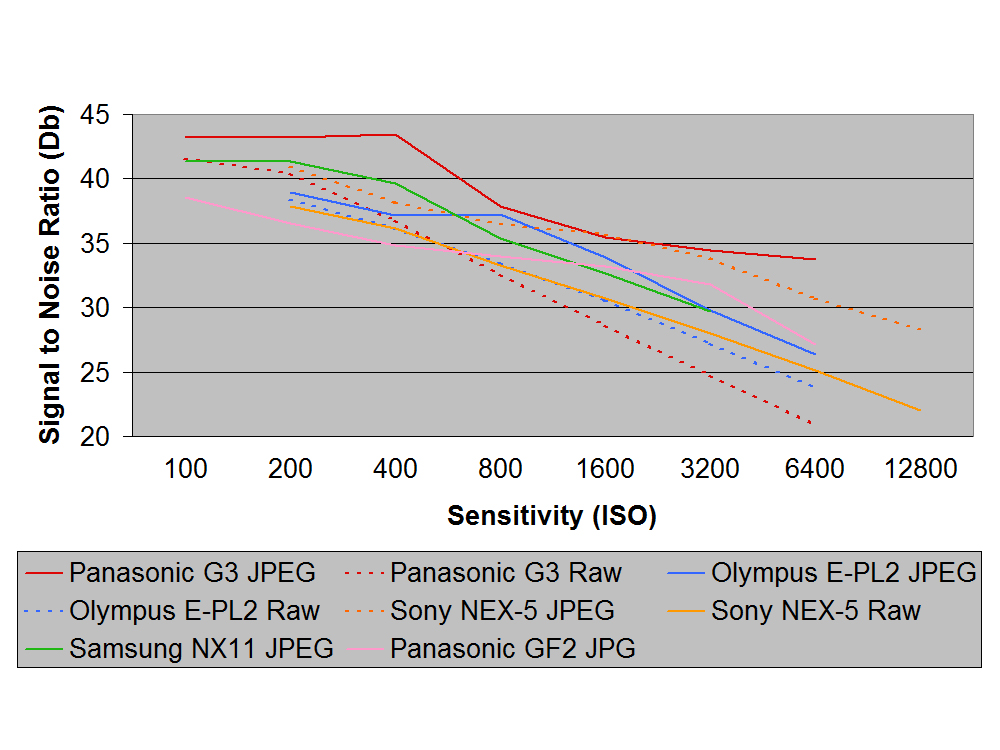
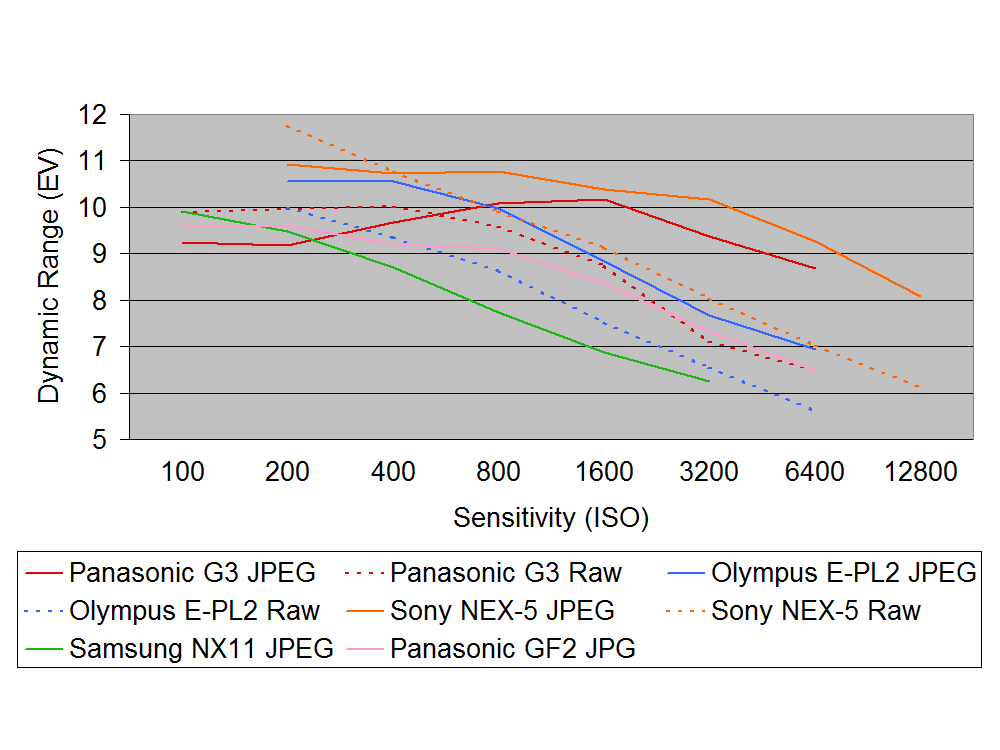
These graphs were produced using data generated by DXO Analyzer. We analysed JPEG images with the camera in its default settings so we can see what you get straight from the camera as well as the raw files following conversion.
A high signal to noise ratio (SNR) indicates a cleaner image. As we would expect, the JPEG images have less noise than the raw files and the level of noise goes up with sensitivity and thus image quality decreases. The difference between the raw and JPEG files gives an indication of the amount of in-camera noise reduction applied.
Signal to Noise Ratio

The solid red line of the G3's trace indicates that the JPEGS have a higher Signal to Noise ratio than any of the other cameras here (Olympus Pen E-PL2, Samsung NX11, Sony NEX5 and Panasonic GF2).
Raw files that have been converted to TIFFs using the default settings in Panasonic's supplied software have a lower Signal to Noise Ratio than all of the cameras from ISO 800 and above.
Dynamic Range

The Sony NEX 5 rules the roost when it comes to dynamic range, but the G3's JPEGs come close from ISO 1000. The dotted red line of the G3's raw files falls roughly half way between those of the E-PL2 and NEX5.
Sign up for breaking news, reviews, opinion, top tech deals, and more.
Current page: Panasonic G3 review: Noise and dynamic range
Prev Page Panasonic G3: Image quality and resolution Next Page Panasonic G3: Sensitivity images