


There's nothing worse. You're deep in thought, working on a really important document, when suddenly the screen turns blue, a cryptic error message is displayed and your PC reboots, losing everything. Isn't Windows just great?
These kind of blue screen crashes are usually due to a buggy driver, but even Windows Vista's much improved error tracking system will rarely point you to the right file.
And so most people end up trying to live with an unstable PC, saving their documents regularly and hoping for the best.
But it doesn't have to be this way.
When Windows crashes it normally saves a dump of the affected memory. Install the free Windows Debugging Tools and you can inspect this file, and get a verdict within minutes that could point you directly to the cause of your problems. Here's what you need to do.
1. Download the debugger
Download the Debugging Tools from their home on the Microsoft site. The program works on everything from ancient Windows NT 4 PCs right up to Windows 2008, so you shouldn't have any problems. The debugging tools aren't quite as reliable in the Windows 7 beta, but can work according to our tests, so if you're trying to diagnose problems with the beta then they may be worth a try.
2. Configure your system
You'll need Windows to save your memory when crashes occur to provide information for the debugger, so it's important that Windows is configured correctly. Right-click Computer and select Properties, click Advanced System Settings > Startup and Recovery Settings > and make sure "Write debugging information" is set to "Kernel memory dump" or "Complete memory dump".
Click Start > All Programs > Debugging Tools > WinDbg, then select File > Symbol File Path. The debugging tools need to download data called "symbols" from Microsoft to help them make sense of your crash file, and you'll give them the appropriate URL here. Enter
SRV*c:\symbols*http://msdl.microsoft.com/download/symbols
in the box, say, and symbols will be downloaded from msdl.microsoft.com and stored in the c:\symbols folder. Click OK when you're done, then click File > Exit, selecting "Yes" when asked to save the workspace (which means the symbols path you've just added). And that's it, your setup work is done.
3. Solve your problems
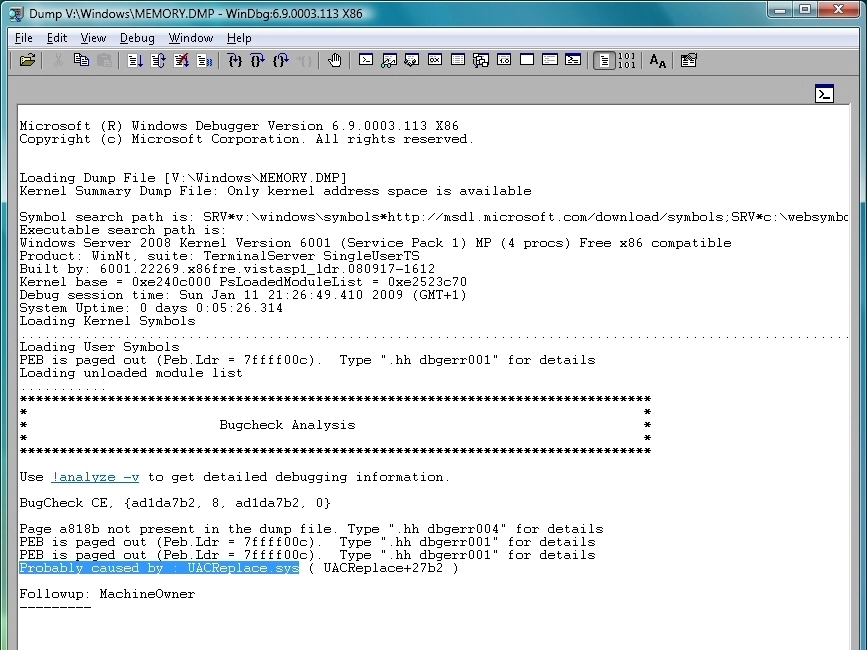
Now wait until a blue screen crash occurs, and your PC has rebooted. Then launch WinDbg again (Windows Vista users should right-click its shortcut and select Run As Administrator), click File > Open Crash Dump, and open the file \Windows\MEMORY.DMP. The program will immediately begin analysing the file.
WinDbg provides very little feedback to tell you what it's doing, unfortunately, and you might think that program has locked up. But be patient. If you're analysing 4 GB of RAM on an underpowered PC then it might take a very long time to complete, even hours, so you might want to leave it running overnight.
Normally you'll get an answer within a few minutes, though, a line near the bottom of the Bugcheck Analysis that says something like "Probably caused by: thisfile.sys". If this happens then Google for the file name, and find out where it's originated. If the program has identified software or drivers that you've installed then you might want to try uninstalling or updating them, just to see if that fixes the problem.
Occasionally WinDbg can't name any file at all, or just chooses a core Windows DLL. If this happens then click in the command window immediately above the status bar, type the command
!analyze -v
and press [Enter]. This will deliver a longer and more detailed report that may offer possible clues.
If you're still out of luck then don't worry, debugging is a complicated business, even for experts. Just close WinDbg down and try again after the next crash - that could well deliver better results.
