Regardless of how well you maintain your PC, some problems will crop up again and again. The hard drive may start thrashing even though you're not running any applications, for instance.
You may find your PC suddenly slows to a crawl for no apparent reason, or maybe it's become unreliable, locking up or crashing and you don't know why.
Article continues below 
Checking the CPU History does a similar job for processor use, showing you what's been making heavy demands on your CPU over the past few minutes.
The Pvt Memory (Private Memory) column is generally the best measure of how much RAM a particular program is using. Click its header to sort the list into ascending or descending order. This is a quick way to identify what's gobbling up most of your valuable RAM.
The Handles column is a measure of how many Windows objects a process has open (windows, files, Registry keys and so on). If this value keeps increasing for a particular process then it may have a resource leak, where it's grabbing new handles but not closing the old ones. If this carries on then your PC will start behaving oddly and eventually crash.
The precise point of failure will vary greatly depending on your Windows version and how it's configured, but we'd pay extra attention to anything using more than 20,000 handles and be highly suspicious of a total that has passed 100,000.
Clicking the Network tab reveals all the internet connections that your processes have open right now. If your internet connection seems slow then look for connections with a state marked 'Established' – these are the ones that are open.
If you're worried about malware then look for 'Listening' connections – these are programs that are waiting to hear from someone else. Don't jump to conclusions, though; lots of programs have listening TCP/IP connections for perfectly legitimate reasons.
Detective work
The main Process Hacker interface might have told you that a particular program is making heavy use of the hard drive or network, for example, but if you don't recognise its name, you'll want to know more. What is this program, and what is it doing?
There are several techniques you can apply to find out more. An obvious starting point is to search for the program's name using Google. There's no need to do this manually; just right-click the process and select 'Search Online', and a browser window will open with search results.
If the web tells you nothing useful, right-click the process name, select 'Properties' and click the General tab. The 'Image File Name' box will give you the folder name where the process is located, which might give you a clue as to its purpose.
Be aware, however, that malware authors may replace an existing executable or save their creation in the Windows folder to try to avoid suspicion.
Clicking the Handles tab (still within the Properties box) will display all the files, Registry keys and other Windows objects that the process has open, which is often a useful clue as to what it's doing.
The Threads tab can be even more informative. It'll show you all the threads that the process has open (a thread being a Windows object that runs executable code), and the Start address will often tell you the functions it's using.
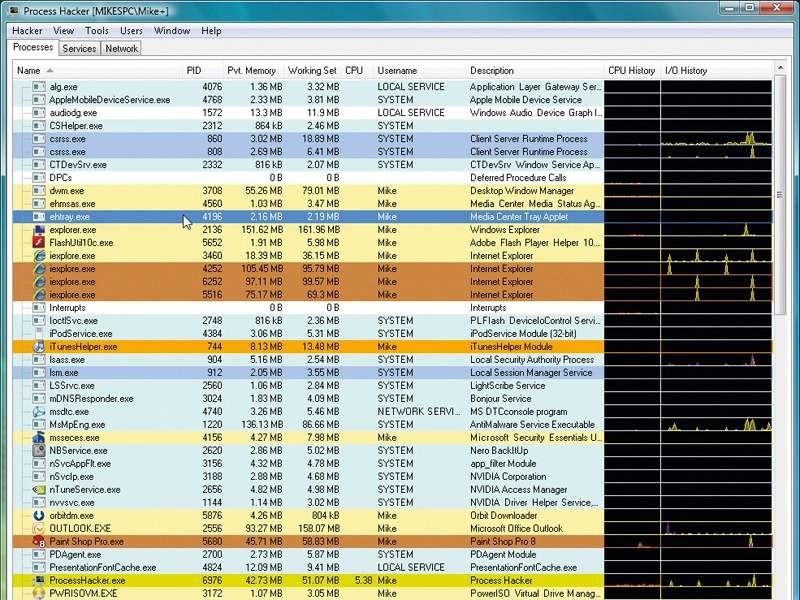
Even if the process 'iTunesHelper.exe' on our test PC had an anonymous name, for instance, the fact that its Threads tab showed QuickTime and 'iTunesMobileDevice.dll' would give you a good idea about where it belonged.
In addition, going to 'Process | Inspect Image File | Imports' displays a list of Windows functions that the program may be using. This can be very technical, but not always. Do this with iTunesHelper.exe, say, and you'll see it references 'WININIT.DLL', along with functions such as 'internetOpenA', 'internetConnectA' and 'internetReadFile'.
Even if you've never done any Windows programming, it's obvious that these functions relate to internet communications, so it's clear that the program may try to go online to send or receive information.
Be careful how you interpret this information, though. A program may reference WININIT.DLL functions but never use them, or list internet functions but never go online.
Another may not reference them, but make an internet connection in a different way. Thus the Imports list only gives you a rough idea about the program's purpose.