TechRadar Verdict
Every serious developer should have a good profiling tool, such as YourKit Profiler for .NET
Pros
- +
Written almost entirely in Java
Real-time CPU usage
Real-time memory usage
Cons
- -
Aimed at .NET 2.0 developers only
Why you can trust TechRadar
Decent developers wants the best performance from their code. Performance becomes crucial under the .NET Framework, because you're arguably starting off at a performance disadvantage relative to native code. The bottom line is that every serious developer should have a good profiling tool, such as YourKit Profiler for .NET. Yes, it's a naff company name, but its English is probably better than your Russian.
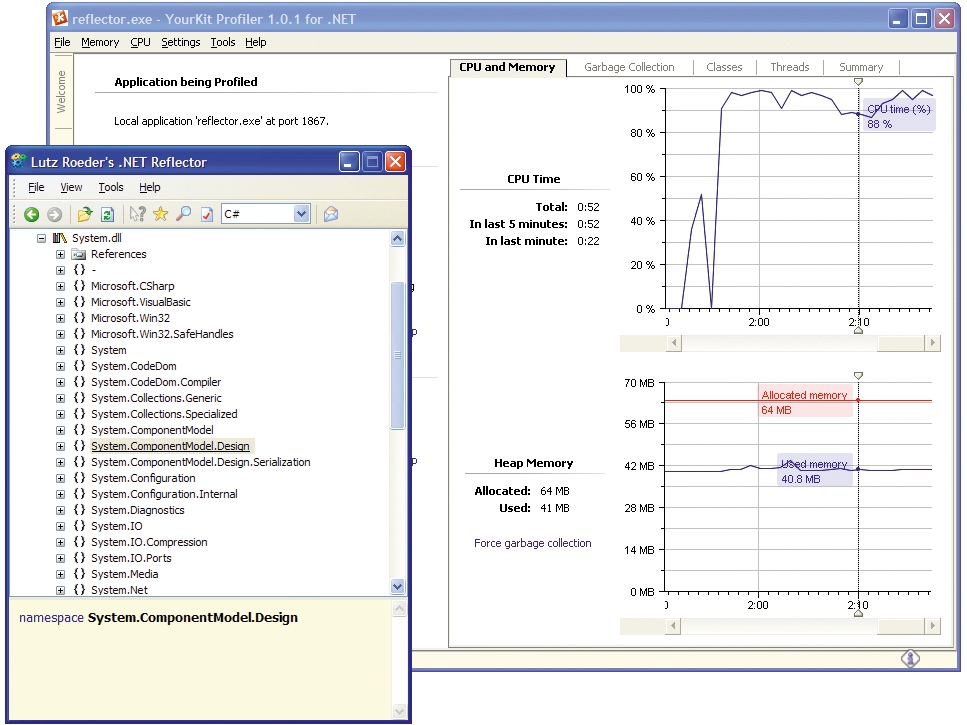
YourKit Profiler is a remarkable tool, not least because it's written almost entirely in Java. Aimed at .NET 2.0 development, the profiler integrates into VS.NET 2005, but can also run stand-alone. Once you specify a .NET executable and start profiling, you'll see a real-time display of CPU and memory usage. Another tab shows time spent in the garbage collector, how many collections have taken place recently, and more.
From here, you can force a garbage collection to take place to watch the effect on performance. Other tabs provide info on the number of running threads and the number of classes loaded. It's fun to try this with Lutz Roeder's Reflector utility - watch the CPU use go through the roof as you start browsing a new assembly...
For more detailed info, the profiler allows you to take a snapshot of the running process; this is automatically saved and can be subsequently reopened for comparative purposes. Within the snapshot, you can view a hotspot listing, showing the methods where the application spent most of its time. You can also see a call tree - either merged or arranged by individual thread - and view back traces of individual methods showing where they were called from.
The ability to 'deobfuscate' a masked application is particularly useful. This works with the popular Dotfuscator .NET utility , as long as you pass the obfuscator's log file to the profiler. The advantage is that you can work with the same obfuscated executable that you supply to customers.
Online help is excellent, while pop-up hints help familiarise you with the user interface. Dave Jewell
Sign up for breaking news, reviews, opinion, top tech deals, and more.
