
 Become a TechRadar Insider


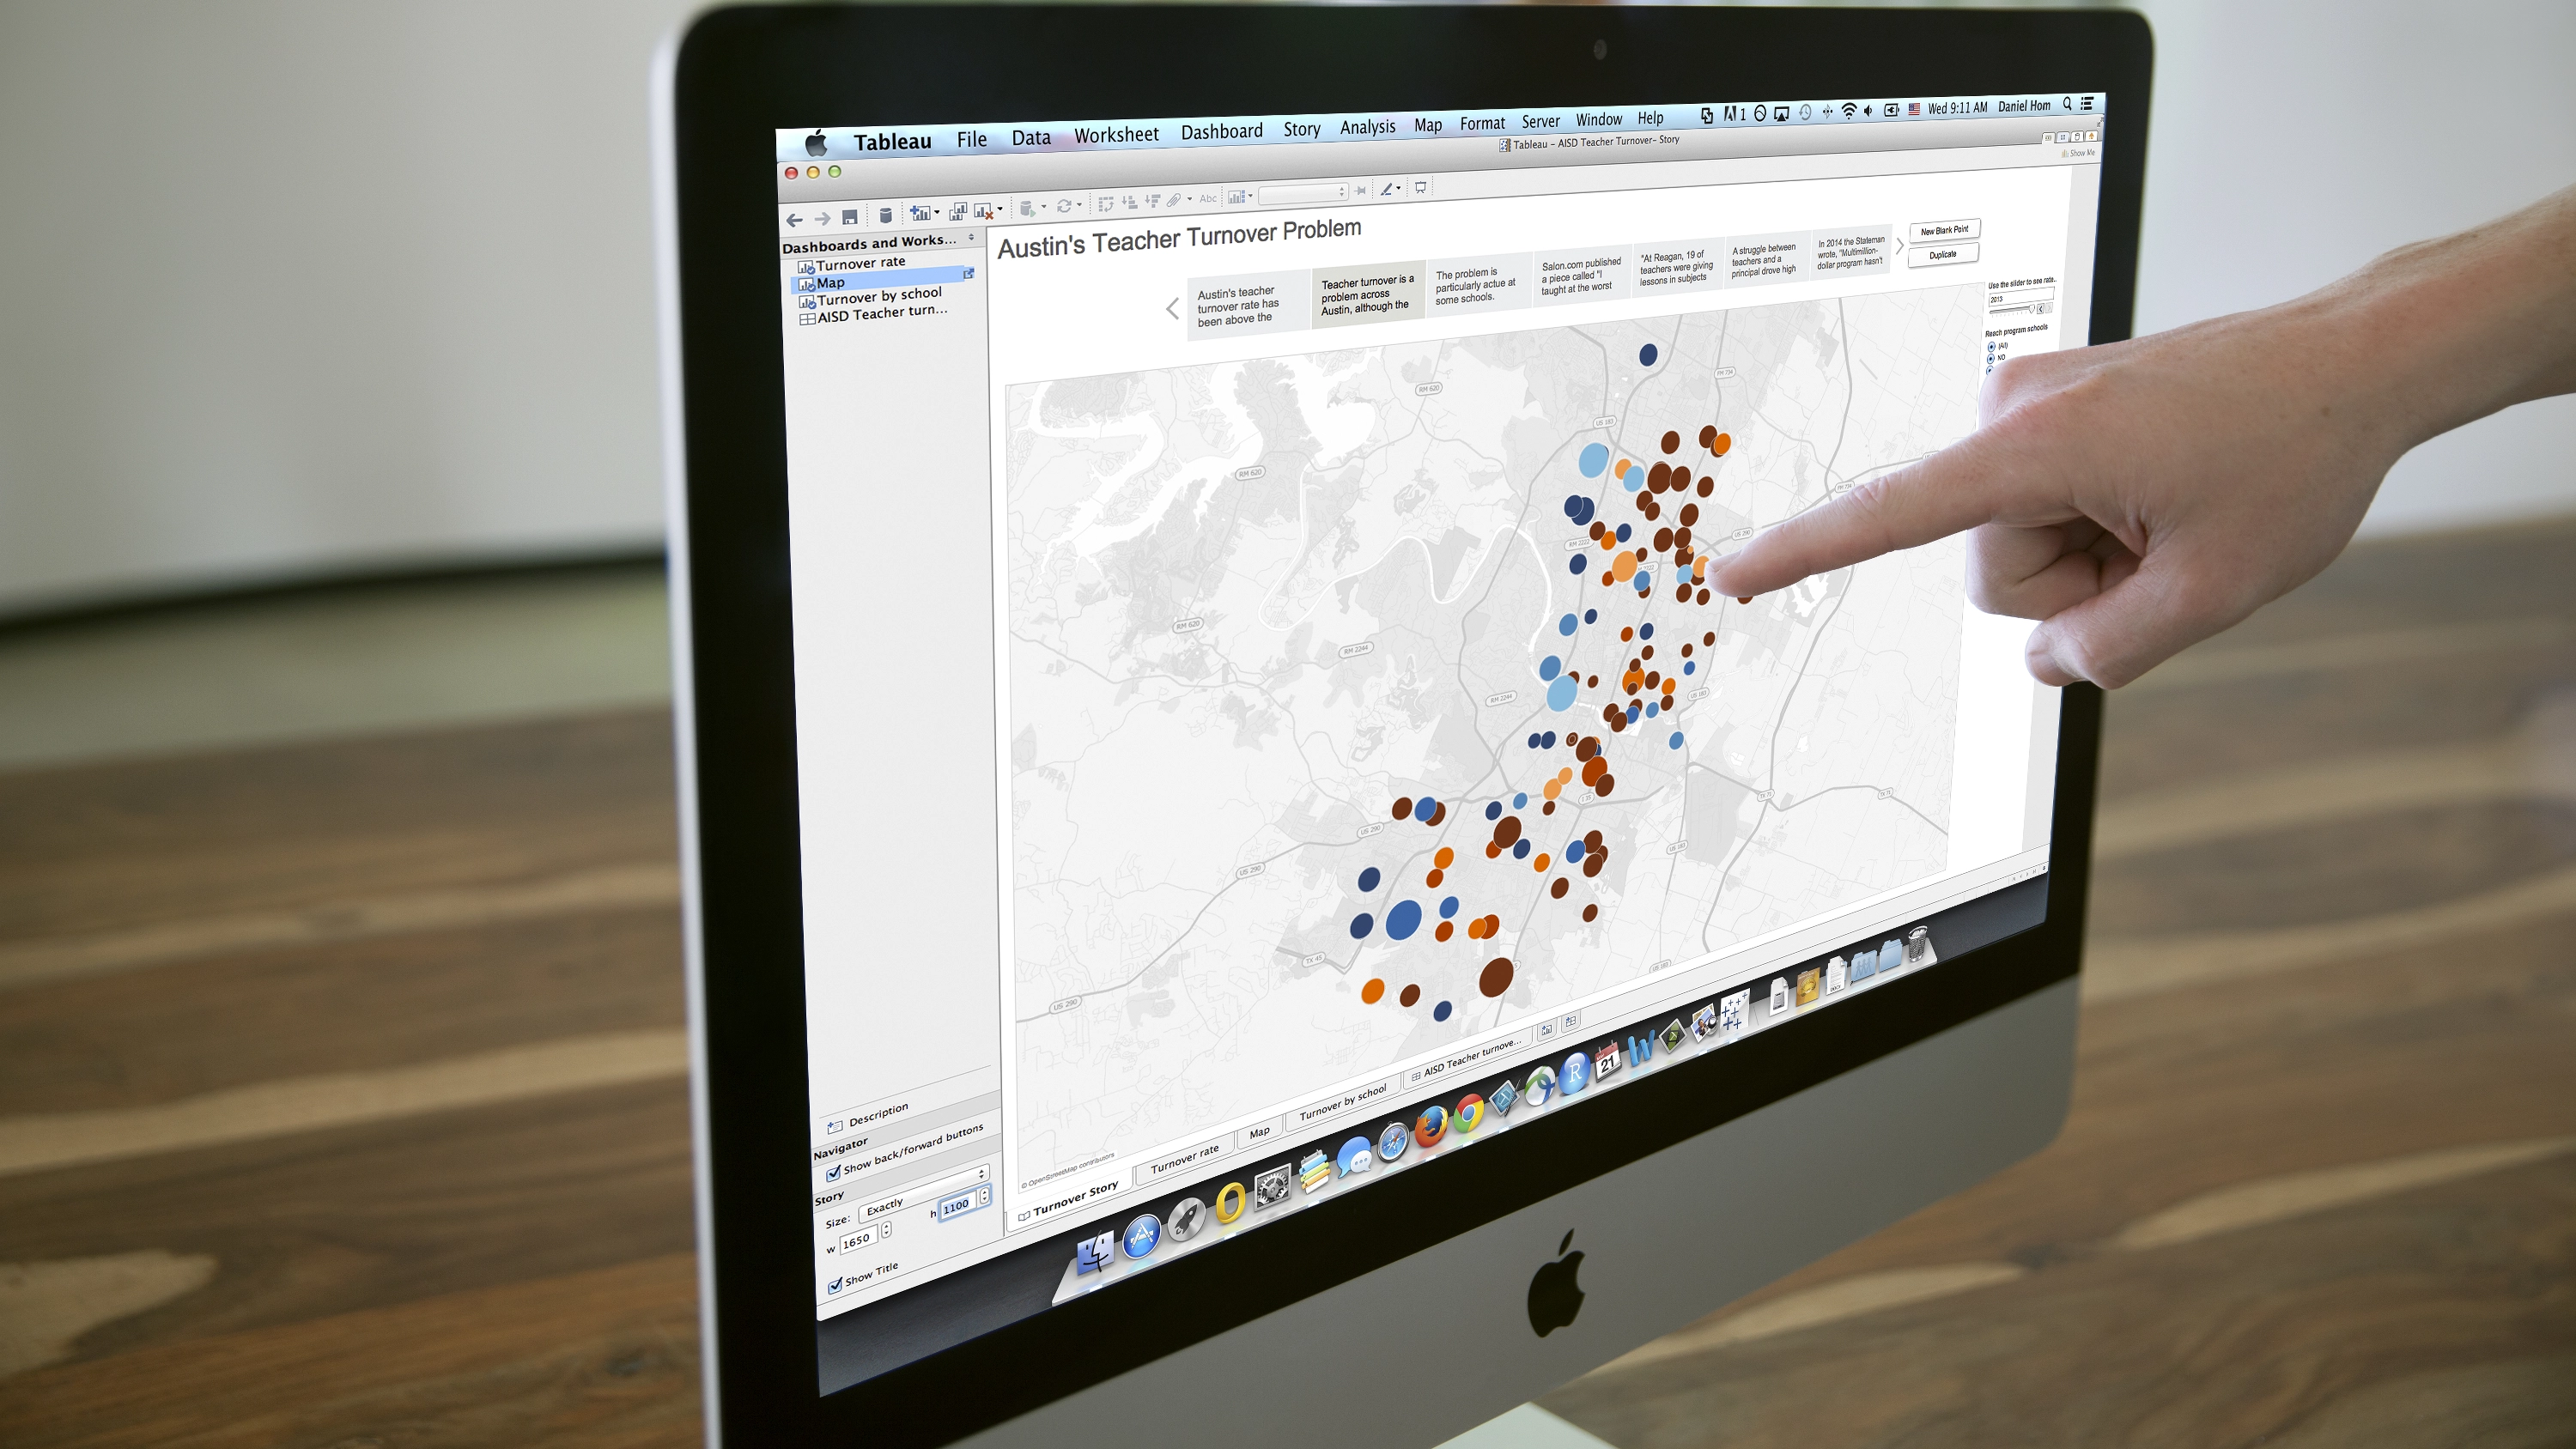
Tableau Software is a data visualisation company that was founded back in 2003 by Stanford University PhD student Chris Stolte (now the company's Chief Development Officer), his PhD supervisor at the time (and Pixar co-founder) Pat Hanrahan, and Christian Chabot, the company's CEO.
Tableau's software connects data sources - like spreadsheets, big data and databases - allowing companies (or individuals) to combine them into visual representations using drag-and-drop and point-and-click mechanisms in a bid to understand and make better decisions from data.
The company recently launched Tableau v8.2, bringing the app onto the Mac for the first time along with new map designs and a feature called Story Points that allows users to assemble sheets and dashboards in a way that lets them to tell stories over time using data.
We spoke to Jock Mackinlay, VP Visual Analysis at Tableau, to find out more about the company's direction and its latest release. Mackinlay, who joined Tableau in 2004 as director of Visual Analysis, was working on information visualisation long before the term even existed having graduated from Stanford in 1986 with a PhD on data visualisation that combined artificial intelligence with computer graphics and UI work.
TechRadar Pro: Tableau Software is often talked about as a leader in data visualisation. What sets the company apart from the competition?
Jock Mackinlay: A number of things have distinguished Tableau from the start. Pat Hanrahan was very skilled at declarative languages, so Tableau's technology was based on this declarative way of describing data visualisations which we called VizQL, which he worked on with Chris [Stolte].
That led to two innovations - a simple user experience and the drag and drop interface that we're familiar with, which can lead to discovery - and the ability to connect to databases. That has completely distinguished us from the early data visualisation companies. Being able to connect to databases in a really authentic and deep way makes us much more useful, and allows regular people to work with their data.
TechRadar Pro: An increasing number of organisations are claiming to be "data-driven". What do you think that means in 2014?
JM: Going back to the old BI way of doing things, some people think that means that you just build a data warehouse and stuff will happen. That isn't how it works. The data is really valuable, but in the end, we have to make the decisions. We come up with intuitions and data is what we use to refine them. That's how we move forward for product direction, and I think that's how successful people who use data in data-driven organisations should use their data.

TRP: Are you finding that businesses moving away from trying to build a "single version of the truth" using data from data warehouses?
JM: That's the classic BI thing - to put up one form of the truth. Data is pooling up everywhere, and when you try to start answering questions using it, you discover that you need data from various sources, so you end up having to ad-hoc combine them. Sure, you can put up a data warehouse, but don't be surprised if there's multiple sources of data in your organisation that you need to combine.
The richer kinds of conversations are what the Story Points feature in the latest release of Tableau are all about. That's all about explaining your findings to people and going through the logical sequences and steps to get conversations going. People might then look at the data and come back with something else along the same lines.
It's not just a case of, "I collected this data and it contracts your data" - it's much more about working with the same data but with different points of view to generate that rich, healthy and useful conversation.
TRP: Did you bring Tableau 8.2 to the Mac to introduce the platform's users to Story Points, or was it in response to demand?
JM: We previously worked on storytelling directly and now it's a natural outcome of what we do - Tableau's core thing is to help people discover things in their data.
Normally when you discover something in data, you almost always need to tell somebody about it, so the Story Points feature is a natural fit. The reason we worked on the Mac had nothing to do with that though, it's just that there's a very large and healthy platform on which people are working with data.
The wonderful thing is that a lot of storytellers use Macs, so you get the synergy of the two features against each other. However, I think we only discovered the synergy now that the release has happened and people have started doing things with it, which is what happens with all of our features.
TRP: How do you decide what goes into future releases?
JM: Forward product direction at Tableau is about what's worked for us for years, which is both a bottom-up and top-down process. On the bottom-up side we get a lot of feedback from our customers - our sales teams are really good about communicating information like that. We get a long list of feature requests as a result. On the top-down side we know a lot about human perception, visualisation, data computation and data performance.
When these two efforts meet we try and find coherent chunks that make sense to work on, make investment in R&D and then ship the features in the next release. It's part science and part art and one of the ways I think data is really useful.
We often have intuitions about what features we should ship with the next release - we use bottom-up data to literally either validate our intuitions or contradict our decisions. It may cause our intuitions to shift slightly so that they become more refined.
