Sponsored by Paessler
What is sFlow and why does it matter?
Capturing samples of network traffic to get accurate insights

You're staring at network performance metrics that don't add up. Traffic spikes appear out of nowhere. Security incidents slip through undetected until it's too late.
As an IT professional, you know monitoring your network traffic is crucial. But traditional methods either consume too many resources or miss critical details. That's where sFlow comes in — a smarter approach to network visibility that won't break your infrastructure or budget.
Get the unlimited trial version for 30 days, absolutely free
For a limited time, new users can head over to Paessler’s website, navigate to the PRTG Network Monitor solution, and click “Free Trial”. They will be redirected to the download page, where they will receive a unique, freshly generated license key. The download will start automatically, and installation can be completed in just a few moments.
Techradar Pro Approved Sponsored Offer
What is sFlow: Definition with examples
sFlow, short for "sampled flow," is an industry-standard packet sampling technology that monitors network traffic by capturing statistical samples of data packets.
Unlike traditional monitoring methods, sFlow randomly samples packets at predetermined intervals rather than analyzing every single packet that flows through your network.
Think of sFlow as taking snapshots of your network traffic instead of recording a continuous video. This sampling approach dramatically reduces the computational overhead on your network devices while still providing accurate, actionable insights about traffic patterns, security threats, and performance issues.
The technology was originally developed by InMon Corporation and has become widely adopted across multiple vendor platforms.
sFlow operates by embedding sampling capabilities directly into network hardware through dedicated chips in routers and switches. This ensures wire-speed performance without impacting your network's core functionality. The sampled data gets packaged into UDP datagrams, then it’s sent to a central collector for analysis.
Example: Imagine your enterprise network handles 10 gigabits of traffic per second. Instead of analyzing all 10 billion bits, sFlow might sample 1 in every 1,000 packets.
This gives you a statistically accurate picture of your network activity — enough to detect a DDoS attack or identify bandwidth-hungry applications — while using minimal system resources.
How does sFlow work? Architecture, components, and explanation
sFlow uses a two-stage sampling process that makes it incredibly efficient for high-speed networks.
First, it performs random packet sampling, where an average of 1 out of N packets gets selected based on your configured sampling rate. Second, it conducts time-based counter sampling, periodically collecting interface statistics and forwarding table information.
The sampling happens at the hardware level using switching and routing ASICs. When a packet gets selected for sampling, sFlow captures the first 64 to 128 bytes of the packet header plus some payload data.
This provides enough information to identify protocols, applications, source and destination addresses, and traffic patterns without storing complete packets.
Unlike NetFlow, which maintains stateful flow tables, sFlow immediately forwards sampled data to collectors without local processing.
This eliminates the need for flow caches on network devices, reducing memory requirements and enabling real-time traffic visibility. The sampled data gets encapsulated into sFlow datagrams and transmitted via UDP to designated collectors using port 6343.
But the accuracy of sFlow depends on proper sampling rate configuration. Higher sampling rates provide more data but consume more bandwidth and processing power. Most networks use sampling rates between 1:512 and 1:4096, balancing accuracy with resource efficiency.
sFlow components and implementation
Implementing this technology requires coordinating several key components for complete network visibility. The architecture follows a distributed model where multiple agents feed data to centralized collectors for analysis and reporting.
Understanding these components helps you plan your sFlow deployment effectively. Each component has specific roles and requirements that impact your overall monitoring strategy.
- sFlow Agent: Embedded software running on network devices that performs the actual packet sampling and counter collection. The agent configures sampling rates, captures packet headers, gathers interface statistics, and formats data into sFlow datagrams. It operates independently on each device without requiring coordination with other agents.
- sFlow Collector: A dedicated server or software application that receives sFlow datagrams from multiple agents across your network. The collector stores, processes, and analyzes the sampled data to generate reports, detect anomalies, and provide real-time dashboards. Many collectors also support SNMP for agent configuration and management.
- Network Equipment: Routers, switches, and wireless access points with built-in sFlow capabilities. Major vendors, including Cisco, Juniper, Arista, and Extreme Networks, provide sFlow support across their product lines. The hardware must include dedicated sampling ASICs to maintain wire-speed performance.
- Analysis Software: Applications that interpret sFlow data to provide network insights, security monitoring, and performance optimization. These tools often integrate with existing network management platforms and can trigger automated responses to detected issues.
What makes sFlow better than other packet sampling solutions?
sFlow offers several technical advantages that make it superior to alternative packet sampling approaches. Its design prioritizes scalability and real-time visibility while minimizing resource consumption on network infrastructure.
The most significant advantage is sFlow's stateless operation. Unlike NetFlow, which requires devices to maintain flow tables and perform local aggregation, sFlow immediately exports sampled packets to collectors. This eliminates memory constraints and cache overflow issues that can plague flow-based monitoring systems, especially during traffic spikes or DDoS attacks.
sFlow's hardware-based sampling ensures consistent performance regardless of traffic volume. The sampling occurs in dedicated ASICs before packets reach the device's CPU, maintaining wire-speed forwarding even during intensive monitoring. This contrasts with software-based solutions that can impact network performance under heavy loads.
The protocol's vendor-neutral design promotes interoperability across multi-vendor environments. While proprietary solutions like Cisco's NetFlow require specific equipment, sFlow works consistently across different manufacturers' devices. This flexibility simplifies network monitoring in heterogeneous environments and reduces vendor lock-in concerns.

sFlow vs NetFlow vs RMON vs RMON II
Network monitoring encompasses various packet sampling and analysis technologies, each with distinct approaches and capabilities. Understanding these differences helps you choose the right solution for your specific monitoring requirements and network architecture.
These technologies evolved to address different challenges in network visibility. While they share the goal of providing traffic insights, their implementation methods, resource requirements, and output formats vary significantly. Some focus on flow aggregation, others on packet sampling, and some on comprehensive protocol analysis.
Choosing between these options depends on factors like network speed, available resources, vendor ecosystem, and specific monitoring objectives. Modern networks often use multiple technologies simultaneously to achieve comprehensive visibility across different network layers and traffic types.
sFlow
sFlow represents a pure packet sampling approach designed specifically for high-speed network monitoring. It randomly samples individual packets rather than tracking complete flows, making it highly scalable for gigabit and higher-speed networks where traditional flow monitoring becomes resource-intensive.
The technology's strength lies in its simplicity and efficiency. Since sFlow doesn't maintain state information or perform local aggregation, it can operate at line speed without impacting network performance. The sampling occurs in hardware ASICs, ensuring consistent operation regardless of traffic volume or complexity.
sFlow provides deeper packet visibility than flow-based alternatives by capturing actual packet headers and partial payloads. This enables detection of application-layer issues, security threats, and protocol anomalies that might not be visible in aggregated flow records. The real-time export capability also supports immediate threat detection and response.
NetFlow
NetFlow operates as a flow-based monitoring technology that aggregates packets into flows before exporting summary records.
Originally developed by Cisco for routing optimization, NetFlow tracks complete conversations between source and destination endpoints, maintaining state tables until flows expire or terminate.
The stateful approach provides complete flow information, including start times, end times, packet counts, and byte counts. This makes NetFlow excellent for billing, capacity planning, and forensic analysis, where complete session data is required.
However, maintaining flow tables consumes significant memory and processing resources, limiting scalability on high-speed interfaces.
NetFlow exports occur after flows complete or age out, introducing latency in threat detection compared to real-time sampling approaches. The aggregated nature also means individual packet details are lost, making it less effective for detecting certain types of security threats or application-layer issues.
RMON
Remote Network Monitoring (RMON) was developed in 1991 to standardize network monitoring probes for shared network segments. RMON focuses on collecting detailed statistics about network utilization, errors, and protocol distribution through dedicated monitoring devices or embedded probe functionality.
RMON excels at providing comprehensive Layer 2 statistics and historical trending data. It can capture complete packets for detailed analysis and supports sophisticated alarm and event management capabilities. The standard defines nine monitoring groups covering statistics, history, alarms, hosts, host top talkers, matrix, filters, packet capture, and events.
However, RMON's probe-based architecture doesn't scale well in modern switched networks. The technology was designed for shared media where a single probe could monitor all traffic, but today's switched infrastructure requires probes on every segment. This makes RMON deployment expensive and complex for large networks.
RMON II
RMON II extends the original RMON standard to provide network and application layer monitoring capabilities. It adds support for protocol analysis beyond the physical and data link layers, enabling monitoring of IP, TCP, UDP, and application protocols across routed networks.
The enhanced protocol support makes RMON II valuable for application performance monitoring and troubleshooting. It can decode protocol stacks, track application usage, and provide detailed analysis of network conversations.
RMON II also maintains the comprehensive alarming and historical data capabilities of the original RMON standard.
Despite its advanced capabilities, RMON II faces the same scalability challenges as the original RMON. The detailed analysis requires significant processing power and storage, making it expensive to deploy across large networks.
Most implementations rely on dedicated hardware probes or high-end network devices with substantial memory and CPU resources.

sFlow tools you should know about
sFlow monitoring tools are specialized software platforms that collect, analyze, and visualize network traffic data from sFlow-enabled devices. These tools act as central collectors that receive sFlow datagrams from network equipment and transform raw packet samples into actionable insights. They provide real-time dashboards, historical reporting, and alerting capabilities to help you understand network behavior.
The tools work by establishing UDP connections with sFlow agents running on your network devices. When agents send sampled packet data to collectors, the tools decode the information and correlate it with interface statistics. This creates comprehensive views of bandwidth usage, application performance, and security threats across your entire infrastructure.
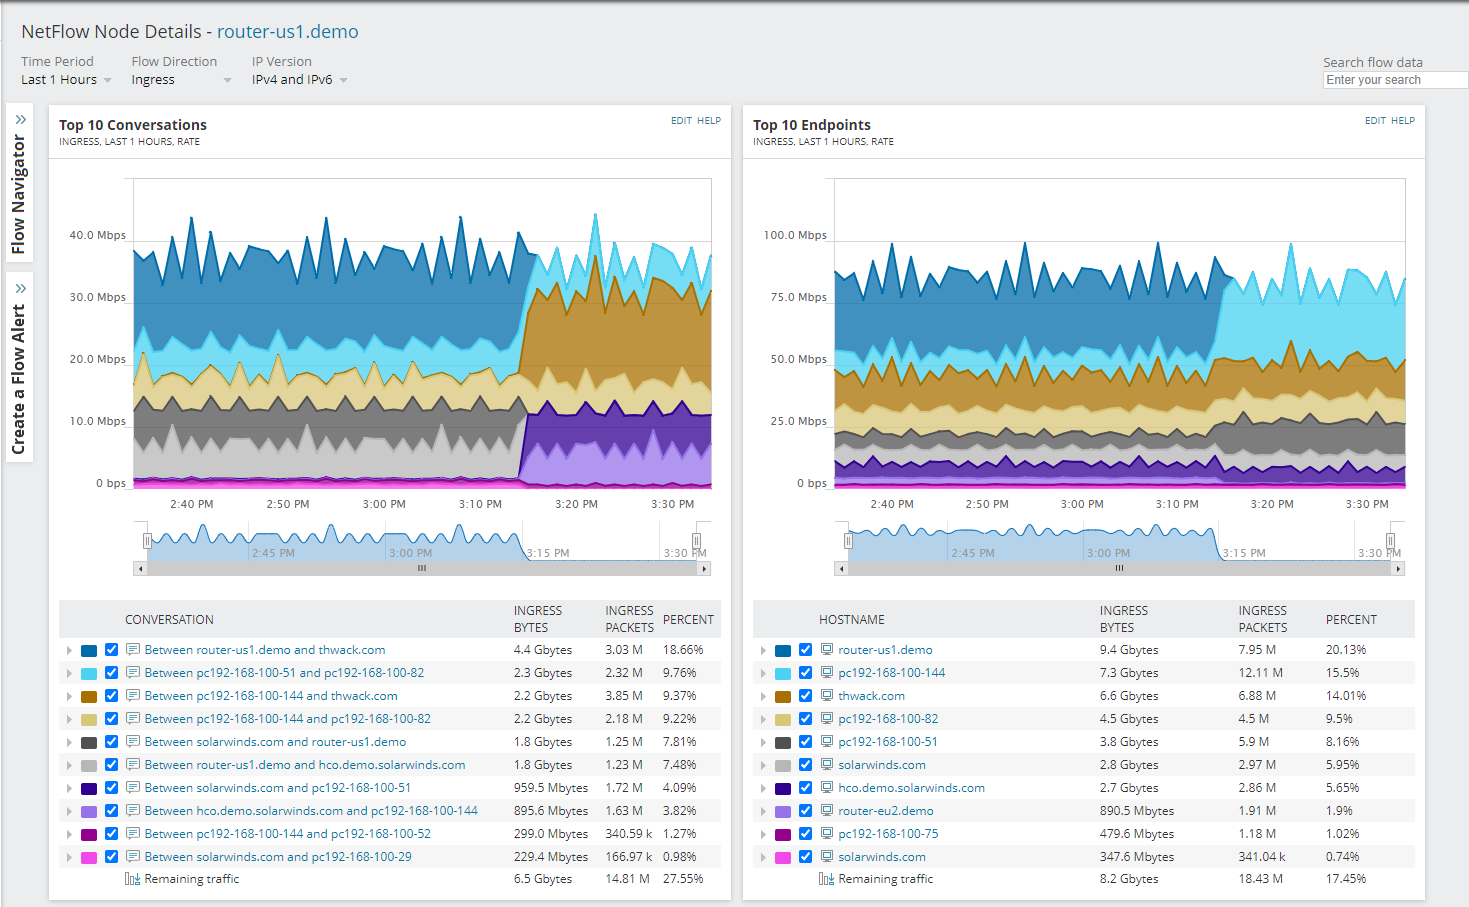
- SolarWinds NetFlow Traffic Analyzer: A comprehensive commercial solution that supports sFlow alongside other flow protocols like NetFlow and J-Flow. The tool provides detailed bandwidth analysis, application monitoring, and customizable alerting through an intuitive web interface. It integrates seamlessly with other SolarWinds products and offers a 30-day free trial.
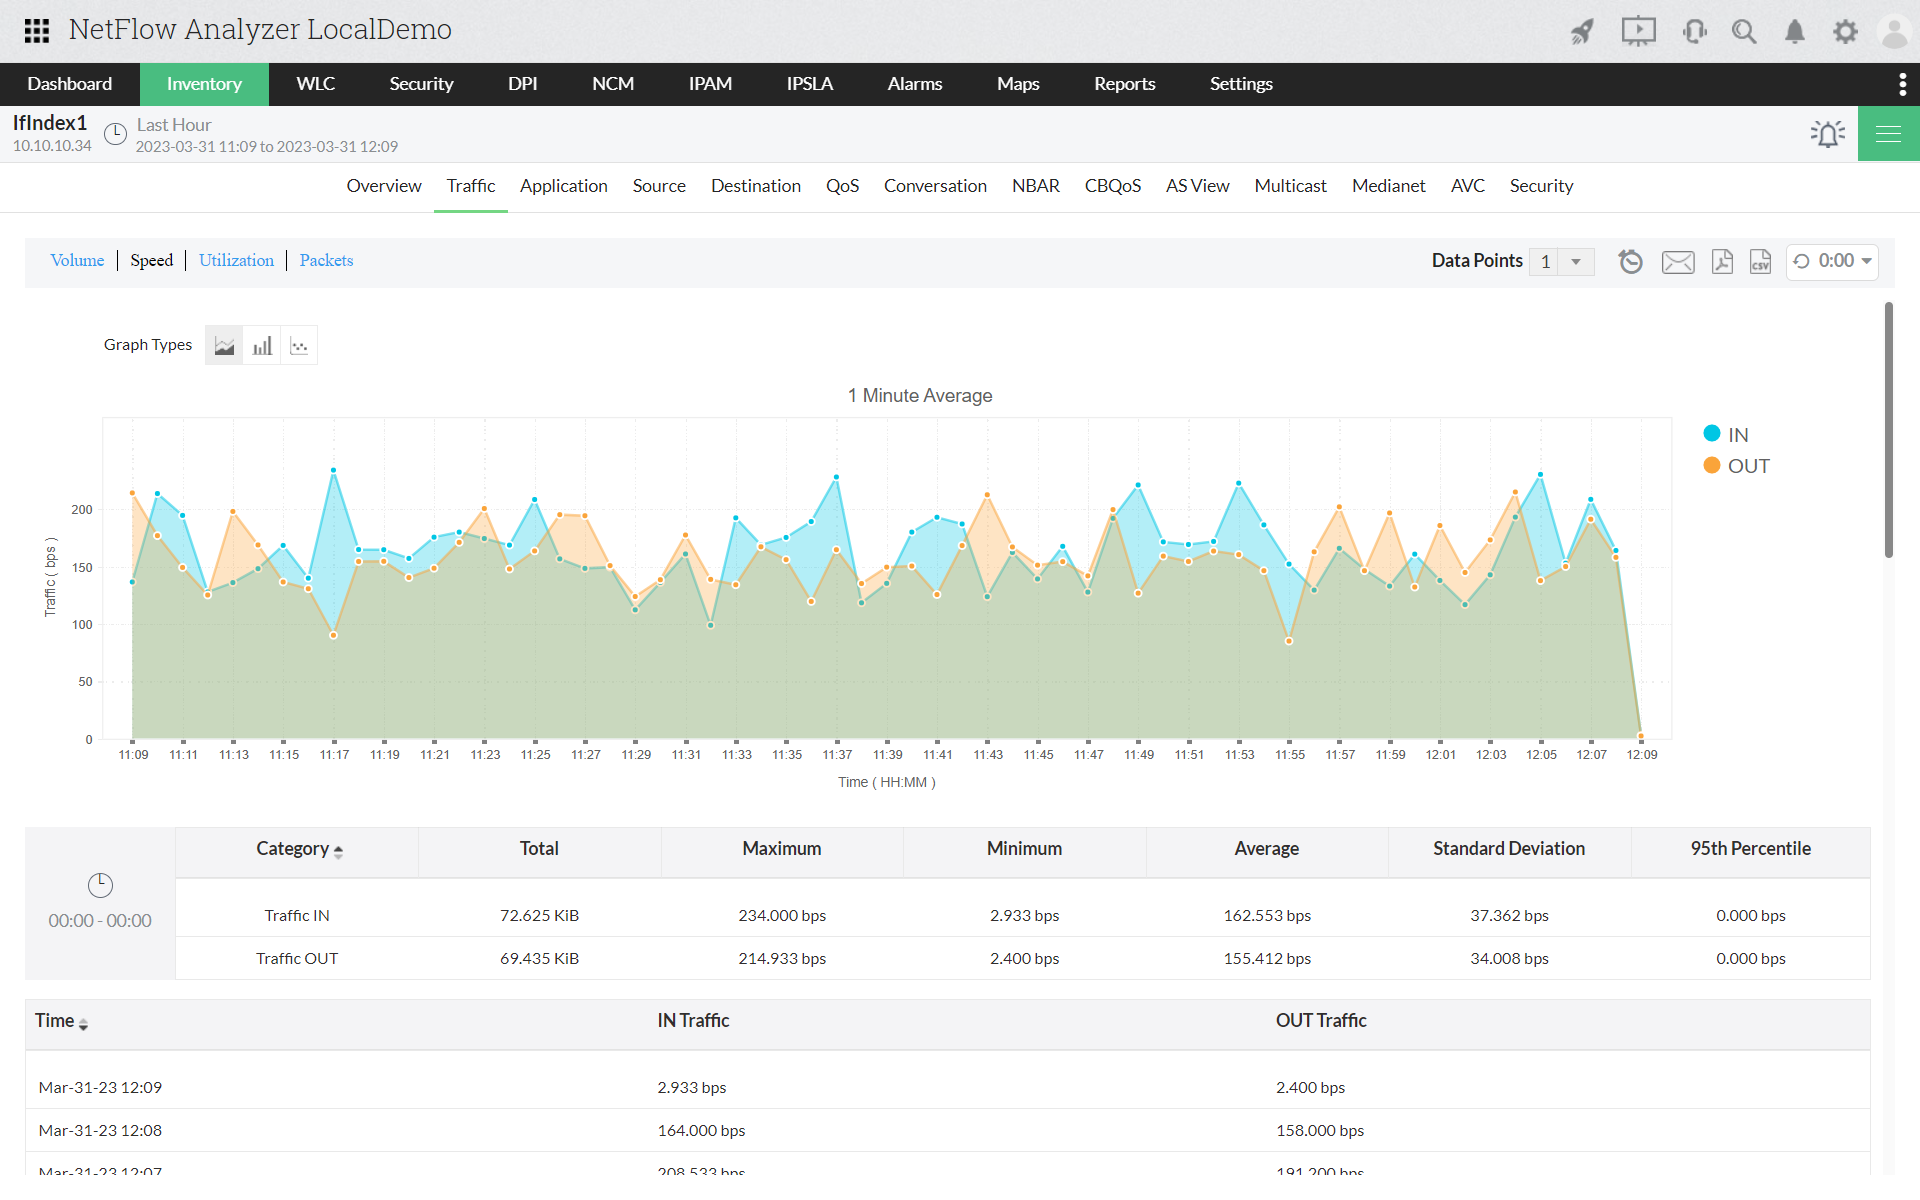
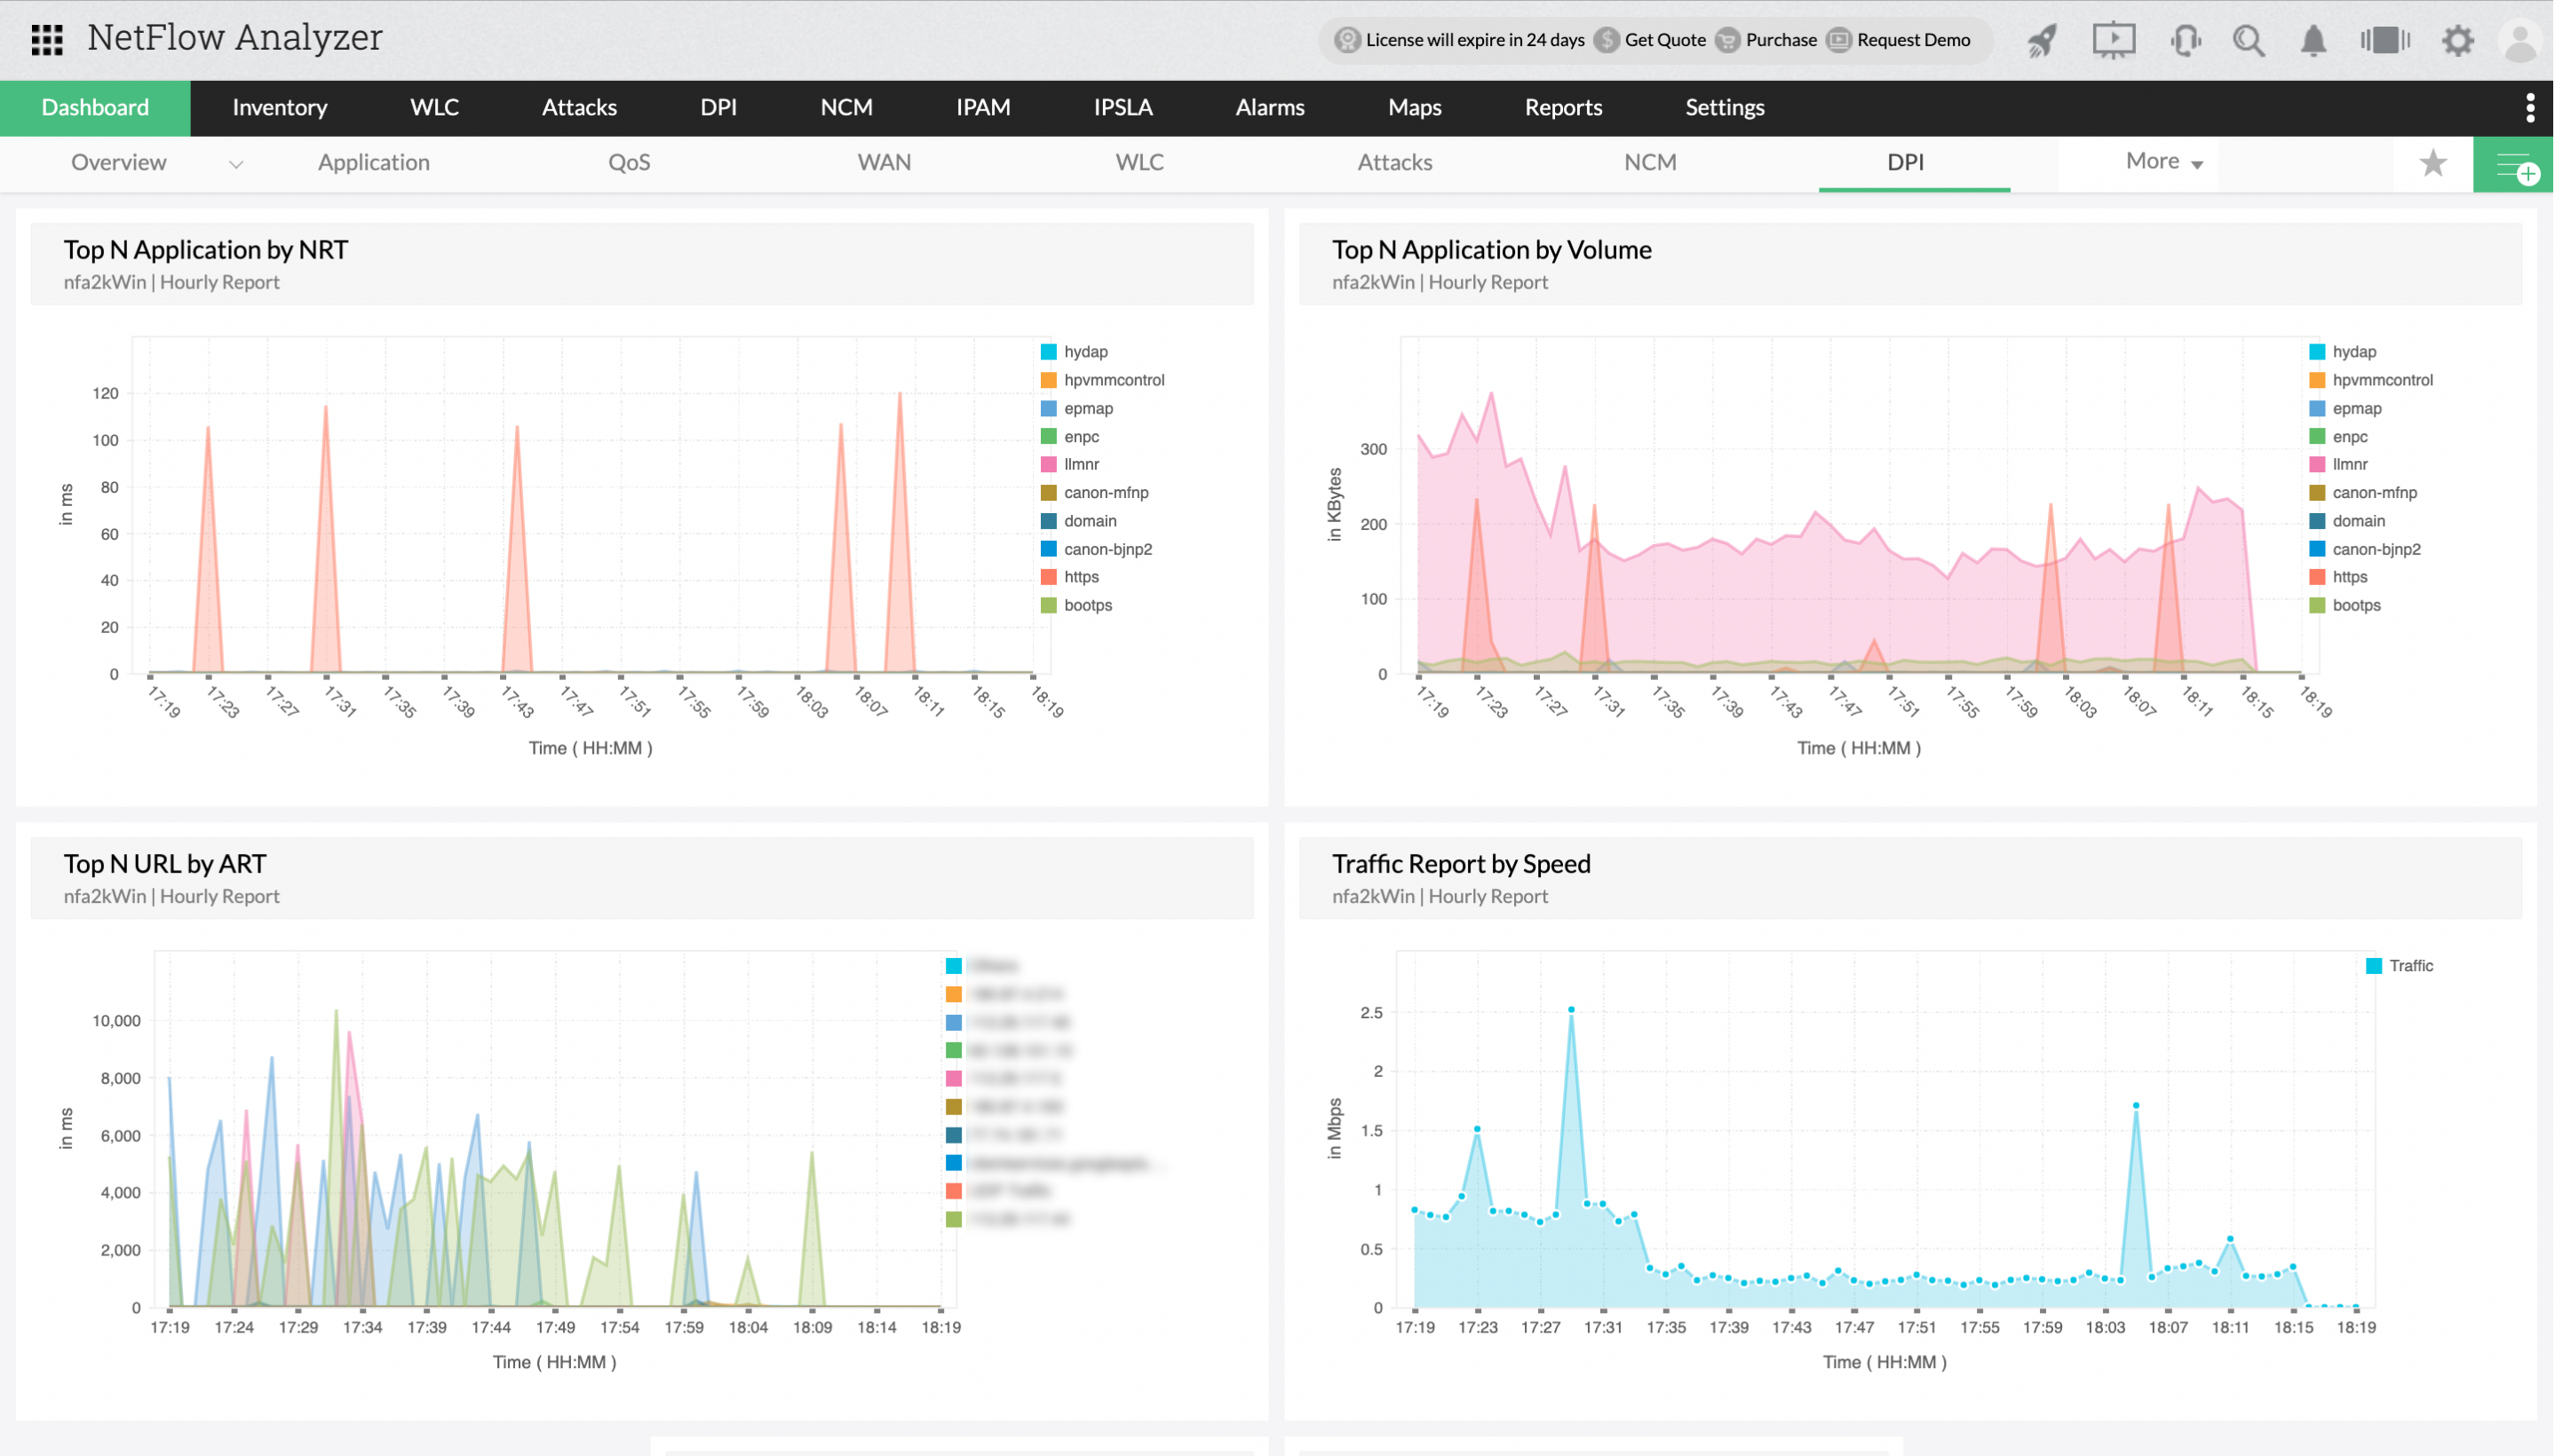
- ManageEngine NetFlow Analyzer: An enterprise-grade monitoring platform that covers sFlow-supported devices with real-time traffic details and top talker identification. The tool excels at providing network-wide visibility and supports multi-vendor environments with detailed reporting capabilities. It offers both on-premises and cloud deployment options.
- inMon sFlowTrend: The original sFlow monitoring tool created by the inventors of the sFlow protocol itself. The free version monitors up to five devices with one hour of data retention, while the pro version removes these limitations. It provides network mapping, traffic statistics, and threshold-based alerting with both Java and web-based interfaces.
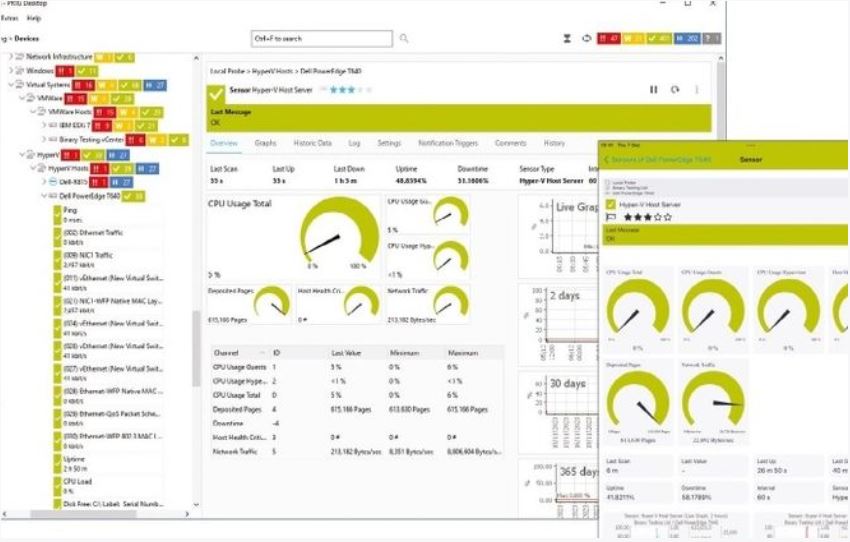
- PRTG Network Monitor: A unified monitoring solution that includes sFlow capabilities alongside comprehensive network monitoring features. The tool works with any sFlow-compatible device and provides a single pane of glass for all network visibility needs. It offers flexible licensing options and supports both on-premises and cloud deployments.
- Kentik Detect: A cloud-based network analytics platform that leverages sFlow data for advanced traffic analysis and DDoS protection. The tool provides real-time insights into network performance and security threats with machine learning-enhanced anomaly detection. It's particularly strong for service providers and large enterprises requiring scalable monitoring solutions.
sFlow technology: Pros, cons, and use cases
sFlow works best for environments that require high-speed monitoring without noticeable performance impact. Yet in spite of its advantages, sFlow has limitations that may affect its suitability for certain use cases. Let's unpack all of that in detail.
Use cases
- High-speed network monitoring: sFlow scales effortlessly to 10Gbps and beyond without impacting router or switch performance. The hardware-based sampling occurs at wire speed, making it ideal for backbone networks and data center environments where traditional monitoring would create bottlenecks.
- Multi-vendor network visibility: Organizations with diverse network equipment benefit from sFlow's vendor-neutral approach. Unlike proprietary solutions, sFlow provides consistent monitoring across Cisco, Juniper, Arista, and other manufacturers' devices in a single platform.
- Real-time security monitoring: sFlow's immediate packet export enables rapid threat detection and DDoS mitigation. Security teams can identify anomalous traffic patterns and respond to incidents within seconds rather than waiting for flow aggregation.
- Bandwidth accounting and billing: Service providers use sFlow for accurate usage tracking and customer billing. The statistical sampling provides reliable data for capacity planning and revenue assurance without the overhead of full packet capture.
- Application performance monitoring: sFlow captures Layer 2-7 information, enabling deep application visibility. Network teams can identify which applications consume bandwidth and troubleshoot performance issues across the entire protocol stack.

Pros
- Minimal resource impact: Hardware-based sampling preserves network device performance even at high speeds.
- Real-time visibility: Immediate packet export enables instant threat detection and response.
- Scalable architecture: No flow tables or state information required, eliminating memory constraints.
- Multi-protocol support: Captures all traffic types, including non-IP protocols and Layer 2 information.
- Vendor independence: Works consistently across equipment from different manufacturers.
Cons
- Statistical accuracy: Packet sampling may miss short-lived flows or low-volume traffic patterns.
- Limited packet details: Captures only packet headers and partial payloads, not complete packet contents.
- Configuration complexity: Requires careful sampling rate tuning to balance accuracy with resource usage.
- Device dependency: Network equipment must have built-in sFlow support, limiting deployment options.
- Analysis overhead: Collectors require significant processing power to handle high-volume sampled data.
Sign up to the TechRadar Pro newsletter to get all the top news, opinion, features and guidance your business needs to succeed!

Ritoban Mukherjee is a tech and innovations journalist from West Bengal, India. These days, most of his work revolves around B2B software, such as AI website builders, VoIP platforms, and CRMs, among other things. He has also been published on Tom's Guide, Creative Bloq, IT Pro, Gizmodo, Quartz, and Mental Floss.
 Become a TechRadar Insider


