It's available on practically every PC, and the capacity of Excel for data manipulation make it a strong business intelligence (BI) tool. On top of this, Microsoft's spreadsheet application is easy to learn - most of us have used it already - and there are usually no extra costs.
A prime feature of Office 2013, the low cost and big capabilities of Excel make it especially suitable for small and midsized businesses. It can be used as a simple method of importing and combining data from different sources, forming a foundation for any BI strategy.
Creating a BI dashboard
Business intelligence dashboards are used to display data such as sales within a specific area during a set period, using graphs and tables. For example, an SMB may wish to display a product's sales revenue during a three year period in an easy-to-read format.
A The dashboard allows firms to go to a single page for key performance indicators, consolidating and arranging numbers and metrics on one screen. The interface is customisable and SMBs can pull real-time data from multiple sources.
PowerPivot allows firms to bring data locally from the company database into Excel, putting the user in control of their own BI and adding the ability to customise it too.
The PowerPivot window sits inside Excel and allows users to import from the database; users can write a 'query' which is able to extract specific data. PowerPivot queries the database and retrieves the information, bringing it in-memory, where it is compressed and can then be accessed in full by Excel workbook, with a tab created for each element.
SMBs can maintain 'relationships' within the data and then create a dashboard. PivotTable can be used to control what a company wants to analyse and by what measure. This can also be customised in Excel using Slicers.
These are visual controls that allow users to quickly and easily filter data in an interactive way. They can connect to PivotTables, PivotCharts, and CUBE functions - which analyse the data in a hierarchical way - to create interactive dashboards.
Colour and conditional formatting
Excel 'conditional formatting' is also useful as it can create a colour scheme or data bar. DAX is one of the most capable features as it can create a calculated column utilising functional equations, or create a measure in the pivot table, such as year to date of sales.
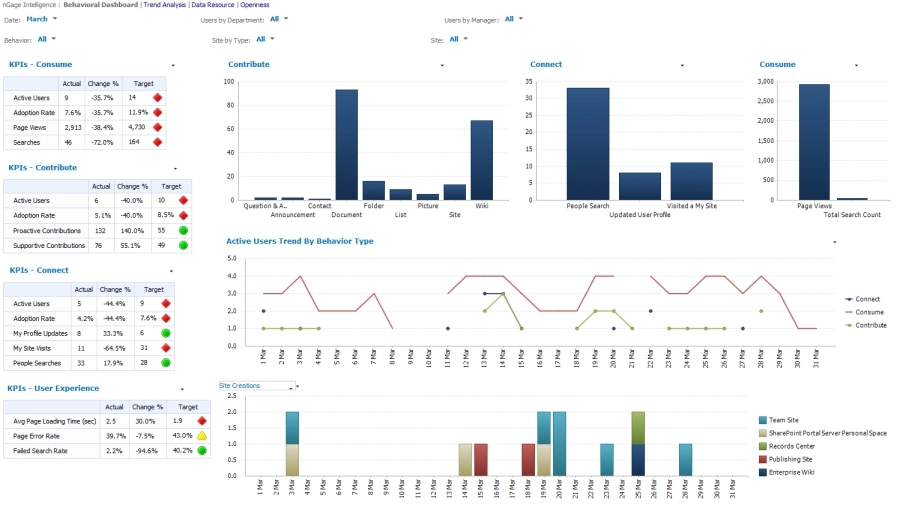
Users can also create a Pivot Chart on the Excel dashboard to visualise the data in a tabulate format (see picture).
The dashboard in the picture shows SharePoint website usage activity, on a PerformancePoint dashboard, which is the Microsoft dashboard system within SharePoint.
"There's no such thing as a standard look of a dashboard, every one will be different, and tailored to the information being displayed. However they usually combine charts, tables and Key Performance Indicators (KPIs)," says Alex Whittles, Business Intelligence Consultant at Purple Frog.
He adds: "Crucially, the filters at the top of the dashboard allow you to customise what data you're looking at. Good dashboards should allow you to click on a number, line or chart of interest, and see more details about the number you've clicked on, or see a detailed report
"Therefore a dashboard should be considered as a launch pad for further exploration, providing a high level answer to 'Is everything OK?', 'Is there anything I should be looking at?'"
Sticking with Office 2010
Microsoft has placed increased emphasis on business intelligence (BI) functionality in its latest Office suite upgrade. But be warned, it isn't free on Office 2013, so some SMBs might be better to stick with 2010.
Users must have the Office Professional Plus version of the new Office to get full access to Excel 2013's BI capabilities through PowerPivot. Office Professional Plus is available to volume licensees and forms part of the Office 365 Small Business Premium Service.
For those with the 2013 version, Power View adds Bing map charts, animated bubble charts and card view visualisations that display images alongside numeric data.
Users can get PowerPivot and Power View with Office Professional Plus 2013 through an Open, Select or Enterprise Agreement; Excel 2013 standalone via Open or Select; or Office 365 ProPlus via Office 365.
Businesses can also get Microsoft's BI capabilities with a minimum of five Office licences through most licensing programmes, or with an individual Office 365 ProPlus subscription.
Despite this possible setback, many SMBs can benefit from using Excel's already established BI capabilities. Firms are likely to use spreadsheets for much of their reporting and analysis tasks and PowerPivot is simply an extension of this. For those with Office 2010 already in place, there's really no need to upgrade.