Excel tutorial – Sales and commissions
5 Excel features to help make your business accounts more effective

I select columns A-H in my spreadsheet and use the filter. I can now sort and filter the data by the various columns:
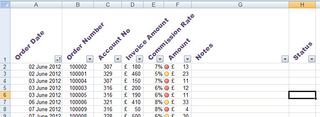
The little drop down buttons on the headers open a filter/sort dialog box when they are clicked on:
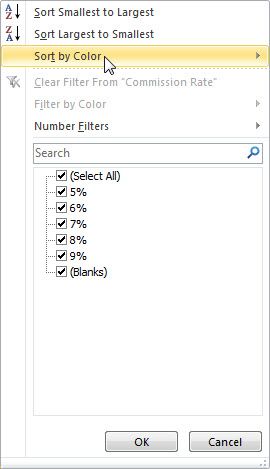
This dialog box lets me sort the data by rows, or display only some rows to look at. I can now pick out a particular customers account out of the long list of orders and figure out what they buy and how to sell more to them.
I am going to setup statuses on each order so that I can start using this list to manage my work.
Our possible statuses for each order will be:
- Placed
- Delivered
- Follow up call required
- Completed
This way I can get a new order – chase up at our end to make sure it is delivered, follow up with the customer to see if they are happy and need a new order and finally close off the transaction.
5/ Validating your data
Lastly I want to be able to filter my work list on the work status to make sure I keep everything on the level.
Are you a pro? Subscribe to our newsletter
Sign up to the TechRadar Pro newsletter to get all the top news, opinion, features and guidance your business needs to succeed!
I select the cells in column H and use the Data Validation dropdown in the Data Tools Panel on the Data Tab:

Selecting Data Validation from the menu opens this dialog box:
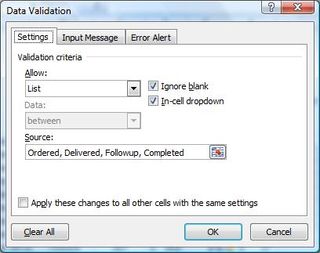
I can set up the status to come from a list of values – Ordered, Delivered, Followup or Completed. When I click on these cells now they look like this:
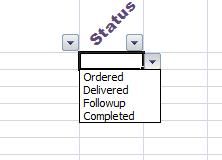
I can now only enter one of those four values in the cell.
Ok that's pretty cool, but the data is one line per order – that's not how I work. I sell to accounts, I need to know how valuable each account is. My fifth and final trick will show you how to do this.
Let's sort the data by account number first – then I am going to use the Subtotal command on the outline panel on the Data tab:

When I select columns A-H and then click Subtotal I get the subtotal dialog box:
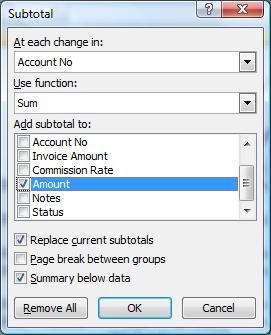
I am going to change it to sum the commission amount for each account number. When I do that I get:
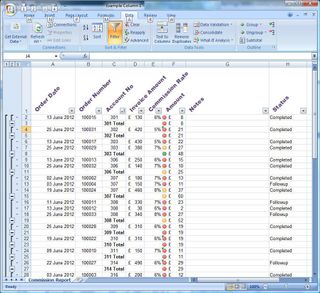
It has now nicely totalled my commission from each account so I can work out which accounts to focus on.
Gordon Guthrie loves spreadsheets so much he has written his own – Vixo, like spreadsheets but better, which you can explore at Vixo.com - follow him on twitter @gordonguthrie.
Most Popular

