Using Linux to map routes and walks
Map your trails and share them with the world
Your Walk Name
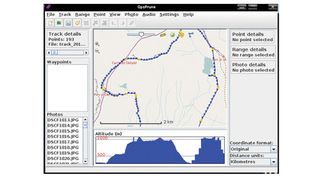
Export from GPSPrune
Your Walk Description
1
575
DSCF1869.JPG
Now you need to convert the XML photo data from the photos.gpx file you created to tab separated data used to display the POI with OpenLayers. Since the data is just XML, you will use a Python script to do the conversion. The code can be found in full on our Archives.
Run the script from the Archives and redirect the output to a file:
./generate_poi.py > poi.txt.
Note that you must have a trailing blank line at the end of the file, or the last POI won't be displayed.
Place the generated file (poi.txt) in the same directory as the HTML page that generates the map.
Displaying on a map

Now you have the geotagged photos, thumbnails and a text file containing the information to display the photos as POI on a map. The final stage is to create an HTML page that contains all the information required to load the map data, and to display the tracklog and photos. You can use almost any web server, since all the work is done in the browser.
Get daily insight, inspiration and deals in your inbox
Get the hottest deals available in your inbox plus news, reviews, opinion, analysis and more from the TechRadar team.
To display the map and associated information, we will use the OpenLayers JavaScript library. OpenLayers is an open source JavaScript library for displaying map data. It works with most modern browsers and is completely client-based, requiring no special software on the server.
Using OpenLayers, you can display your data with the same JavaScript, using maps from all the most common mapping providers, including Google, Ordnance Survey and OpenStreetMap. However, if you want to use Google Maps or the Ordnance Survey, you will need to sign up to obtain an API key. You should read their terms and conditions carefully, as there are various restrictions on how you can use the data.
In contrast to this, OpenStreetmaps is completely unrestricted. Which service you use depends on your particular requirements. In the UK, I find that the Ordnance Survey is best for displaying walking data, but OpenStreetMap is best for cycling maps. However, using the OpenLayers LayerSwitcher widget, you can toggle your map between the different mapping systems, so you can use all three on the same web page if you wish.
The OpenLayers library is extensive and seems overwhelming at first sight. Luckily, there are plenty of examples to get you started. We are going to use the GPX file you created earlier to show the track on an OpenStreetMap. The map will also show the POI you created corresponding to the locations where you took photos.
Clicking on a Point of Interest will display a pop-up window showing a caption and a thumbnail of the photo. Clicking on the thumbnail will display the full-sized photo in a pop-up window.
LayerSwitcher
The first step is to generate a page that displays a map of the area you're interested in. You're going to use the OpenLayers LayerSwitcher, which will enable you to switch between various OpenStreetMap layers. You can also use it to switch between different maps, eg Google and OpenStreetMap.
The complete code for the web page is too long to show here, but is included over in the Archives.
Here are some tips and tricks:
Make sure that your page has a valid DOCTYPE, or weird things will happen.
