MicroStrategy opens door to analytics with free data visualization tool
Desktop software has 100MB data upload cap

MicroStrategy is taking on Tableau Software and others in the data visualization field with a free desktop-based analytics tool to help organizations gain insights from their data.
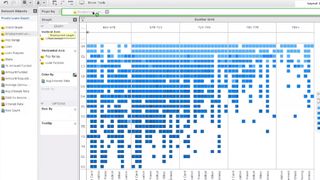
Dubbed MicroStrategy Analytics Desktop, it lets users create pie graphs, matrices, networks, maps and other visualizations with data pulled from various sources that include Excel, relational databases, multi-dimensional databases, cloud-based applications or Hadoop.
Once created, visualizations can be dragged and dropped into dashboards to help users spot patterns and changes in data, which can be loaded from different sources and combined to make new metrics.
Data limit
Users can then export dashboards as an image, PDF file or a MicroStrategy Analytics Desktop file. The free version of the software comes with an upload limit of 100MB per file and allows up to 1GB of stored data to be loaded from a data source.
Kevin Spurway, senior vice president of product marketing at MicroStrategy, told TRPro that small businesses can use the software to spot trends or anomalies in data.
He said: "It might enable businesses to pinpoint products that are most popular with a specific demographic profile, such as age or income level, which would then help them to target their marketing spend."
MicroStrategy Analytics Desktop can be downloaded now from the company's website.
Are you a pro? Subscribe to our newsletter
Sign up to the TechRadar Pro newsletter to get all the top news, opinion, features and guidance your business needs to succeed!
- It all sounds a bit like the time Microsoft added PowerBI to Office 365.

