Best APM tool of 2024
Application Performance Management software platforms
We've featured the best APM tools, to make it simple and easy to deliver data and insights into the performance of your applications.

1. Best overall
2. Best for monitoring
3. Best for scalability
4. Best free tier
5. Best for analysis
6. FAQs
7. How we test
No business develops an app and calls it a day. It’s essential to monitor every app to ensure it’s delivering optimal performance and meeting customer goals. If not, there’s a need to make changes to avoid losing customers. How can you monitor apps effectively? Enter application performance monitoring (APM) tools.
APM tools deliver data and insights into the performance of your applications. With these insights, developers, IT teams, and reliability engineers can easily identify the cause of any issues and solve them. APM tools play a major role in an enterprise’s success, ensuring that their customer-facing apps run smoothly with low downtime.
An APM tool highlights issues with your app so that you can solve them swiftly and please your customers. It provides rapid diagnosis to identify and fix bugs, which keeps downtime to a minimum and prevents potential financial losses. It also makes it easy to determine the right amount of computing resources and infrastructure your app needs to function, keeping costs to a minimum.
We tested different APM tools to identify the best ones. We selected the finalists based on important factors including pricing, ease of use, customer support, etc. These tools have their pros and cons but are, overall, the most effective for monitoring your application performance.
We've also featured the best ITSM tools.
The best APM tools of 2024 in full:
Why you can trust TechRadar
Best overall
1. Datadog APM
Reasons to buy
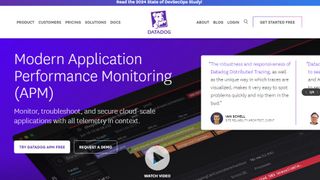
Datadog is a well-known observability platform for cloud services. You can use it to monitor, troubleshoot, and help improve any cloud-based application.
This platform helps you identify the root causes of any issue in your application with code-level tracing. It can trace an issue down to the line of code so that you can modify or delete the code to solve it. It gives you live access to all traces over the past 15 minutes, making it faster and easier to resolve active issues. This same tool gives you insights into the execution time and computing resource consumption of every line of code on your app.
Datadog provides health metrics for your app. It helps you identify threats and code vulnerabilities in live production so that you can tackle them before they morph into something serious. Datadog has a very intuitive interface that makes it enjoyable to navigate; check user reviews, and you’ll often see this as the highlight.
The main disadvantage of Datadog is that it’s a pricey tool, starting at $31 per host per month.
Best for monitoring
2. Dynatrace
Reasons to buy
Reasons to avoid
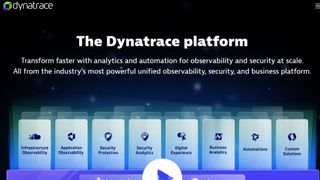
Dynatrace is a popular application performance and network monitoring tool. It gives you deep insights into your full application stack. You can monitor your application development environment from top to bottom and understand how everything is connected.
This platform offers code-level monitoring, so you can identify the source of any issue down to the line of code. It can check for vulnerabilities and bugs in your code to help you fix them.
Dynatrace has native integrations with many cloud services including AWS, Azure, Google Cloud, and VMware. If you use any of these services, it’s easy to connect your app to Dynatrace to get performance insights.
Dynatrace incorporates artificial intelligence and machine learning techniques to help troubleshoot issues with your app. This AI engine called Davis continually scans your app to detect flaws before they turn into expensive problems.
Dynatrace has an intuitive interface that’s easy to navigate. The main drawback is that it’s pricey, with full-stack monitoring starting from $0.08 per hour. You can take advantage of the free trial period to test its features before making your final decision.
Best for scalability
3. LogicMonitor
Reasons to buy
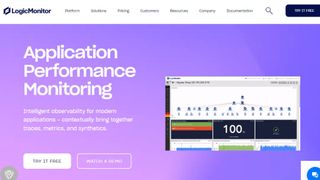
LogicMonitor is well-known cloud infrastructure monitoring tool. It offers an application monitoring tool that gives you deep insights into your applications. This tool covers every part of your application architecture, enabling you to identify potential issues or the source of issues that have already occured. The proactive monitoring helps you prevent potential outages and save time and money.
LogicMonitor provides great insights into your user behavior. It delivers these insights in a dashboard that’s easy to navigate and monitor. LogicMonitor was built with a collaborative focus, so all your ITOps and DevOps staff can work from a shared dashboard. It gives them a bird's eye view into your application and visualizes the relationships between all app components. This platform works with both hybrid and multi-cloud environments.
This platform scales very well. It can keep monitoring your app as it grows without sacrificing performance. In fact, LogicMonitor is known to work very well with large-scale apps.
Like many APM tools, LogicMonitor has a steep learning curve. It’ll likely be challenging to use at first, but you can get used to it with time.
Best free tier
4. New Relic
Reasons to buy
Reasons to avoid
New Relic is a well-known web tracking and analytics platform. It offers an application performance monitoring tool that lets enterprises stay on top of their apps and online services. New Relic has integrations with popular cloud services like AWS, Azure, and Google Cloud, so you can easily connect it to your apps hosted on these platforms.
New Relic constantly monitors your apps to detect anomalies and alert you to them. If there's any issue, you can troubleshoot the app to discover the root cause. It gives you insights into your code performance so that you can optimize it for better results.
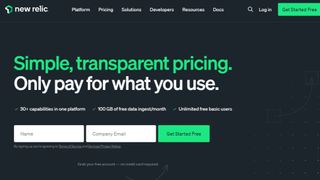
New Relic offers a free version with significant features, unlike most other APM tools. The free version supports one user and lets you ingest up to 100GB of data per month. Anything above this feature will need a payment, starting from $0.30 per GB of ingested data. You also need to pay a monthly fee of between $49 and $99 for each user.
Best for analysis
5. Sumo Logic
Reasons to buy
Reasons to avoid
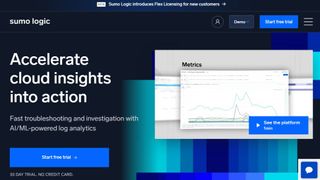
Sumo Logic is a well-known cloud analytics platform. It offers a full-stack application monitoring and observability tool for enterprises. This tool provides insights into every aspect of your application. It automatically discovers any new computing resource added to your stack and starts tracking it, so you don't need to waste time manually adding it.
Sumo Logic lets you visualize the components of your app and how they depend on each other. It offers real user monitoring (RUM), so you can track how users are interacting with your app and quickly identify any lag in performance.
This software automatically scans your apps to detect anomalies and alert you to them. If you observe any issue, you can use the Root Cause Explorer to try and pin down the source.
Sumo Logic keeps accurate logs of every issue or anomaly it detects on your apps, so that you can review them later, even after solving the issue.
Application observability starts at $2.10 per GB, which is relatively expensive. There’s no free version or free trial, which we consider a disadvantage.
We've featured the best cloud computing services.
FAQs
How to choose an APM tool
1. Cloud service integration
What cloud computing services do your APM tool have integration with. Popular cloud services include Amazon Web Services (AWS), Google Cloud Platform (GCP), Microsoft Azure, etc., and your APM tool should integrate with these services for easy monitoring.
2. Ease of use
It is essential for your APM tool to be easy to use and navigate. It should be a tool you can set up and deploy quickly with minimal hassles. It should have an intuitive dashboard making it easy to monitor every aspect of your app.
3. Cloud vs. on-premise
Do you need a cloud-based tool or one that you can deploy on your own servers? The good thing is that you can always find cloud-based or on-premise APM tools to use. Many tools offer both types, so you shouldn’t have a problem.
4. Cost
Cost is a non-negotiable factor when choosing any software. You should pick something you can afford in the long term. Different APM tools have different pricing structures, so ensure you study that of your desired tool. Read the fine print to see if there are any hidden costs. You can take advantage of the free trial period to test the features before making your final decision.
Essential features of an APM tool
1. Server monitoring
Servers are essential requirements for every app. Thus, your APM tool should let you monitor your servers to detect any issues. You should be able to monitor the server's uptime and load at any period. This will help you determine how to configure the server for optimal usage.
2. Real User Monitoring (RUM)
RUM is a type of monitoring that captures every action a user takes on your desktop or mobile application. It gives you insights into actions like page views, what buttons the user clicked, how long they spent on the app, etc. These insights tell you just how users are interacting with your app and helps you make needed user-centric changes.
3. Root cause analysis
No app can run perfectly; you’re bound to experience issues from time to time. If there's any issue, your APM tool should let you run a root cause analysis to determine the source. This troubleshooting will not always reveal the issue, but it can reveal it most times. It’ll help you quickly identify the source of any app downtime and fix it before it causes significant damages.
How we test
We test the best APM tools by evaluating numerous factors. To start with, we look at the feature set, the range of tools available, and what size of businesses this would be ideal for. We consider how easy the setup is, the simplicity of the interface, and whether there's sufficient documentation and tutorials for users to utilize necessary options optimally.
We assess how well the service integrates with other relevant apps, and check the overall scalability of the service. We also analyze whether there are collaboration features for multiple users, and lastly, we judge the quality of the customer service and the different pricing plans available.
Read more on how we test, rate, and review products on TechRadar.
Get in touch
- Want to find out about commercial or marketing opportunities? Click here
- Out of date info, errors, complaints or broken links? Give us a nudge
- Got a suggestion for a product or service provider? Message us directly
- You've reached the end of the page. Jump back up to the top ^
Are you a pro? Subscribe to our newsletter
Sign up to the TechRadar Pro newsletter to get all the top news, opinion, features and guidance your business needs to succeed!
Stefan has always been a lover of tech. He graduated with an MSc in geological engineering but soon discovered he had a knack for writing instead. So he decided to combine his newfound and life-long passions to become a technology writer. As a freelance content writer, Stefan can break down complex technological topics, making them easily digestible for the lay audience.

